


The President signed the refining authority in April, and $1 billion has moved to the Energy Department. But ENB found no refinery award; most of the law expires Dec. 11, and the first big new refinery since 1977 is not due until 2028-29. The barrels that could come fastest are restarts and a wider shipping waiver. Here is what the DPA can and cannot do before and after Nov. 3.
By Stuart Turley, host of the Energy News Beat podcast • Published Oct. 11, 2026 • Analysis and opinion: Stu’s views are labeled. As noted below, Stu will be covering this on Tuesday’s Energy News Beat Stand Up.
Picture a grain hauler finishing harvest in Kansas this weekend. Filling a big rig takes a lot of gallons, and on Saturday night the national average for diesel was $6.28, against $3.67 a year ago (AAA). “Every $1 increase per gallon in fuel costs our members around $400 more per week,” says Todd Spencer of the Owner-Operator Independent Drivers Association (Truckers News). Every truckload of groceries carries some of that cost. So does every heating-oil delivery in New England this winter (ENB heating-oil report).
That is why Washington is talking about a 76-year-old Cold War law. On Friday, three industry sources told Reuters that President Trump will soon direct his department heads to bypass state and local rules and use the Defense Production Act (DPA) to raise oil and fuel output (Reuters via Kitco). Diesel is up 70% since the Iran war began on Feb. 28 (Reuters via MarketScreener). The midterms are 24 days away. And Ukraine keeps hitting Russian refineries after at least four U.S. requests to stop (ENB, Oct. 10).
| Stu’s Take
As I’ve said on the podcast, I see only two ways to bring down the price of gasoline, diesel and jet fuel: demand destruction or more refining capacity. Demand destruction means families and truckers doing without. I would rather build. You may have heard that the first new refinery since 1977 comes online next year. Our own check says the Brownsville project is real, but it is not coming online next year. The developer says late 2028 at the earliest. That is the point. If we wait for greenfield plants, voters will be paying these prices through two more elections. So yes, I think the DPA is the right tool, and now is the time. Use it as a checkbook and a referee, not a press release. Back restarts like St. Croix and Benicia with offtake contracts. Give pipeline steel priority ratings. Ask Congress to renew the law before Dec. 11. And widen the Jones Act waiver this week, because that one is not even a DPA question. Red States have lost 54% of their refineries. Blue States have lost 64% of their refineries. Texas and Louisiana now hold 50% of Total Refining Capacity. The Jones Act Waiver is Critical to keeping prices from skyrocketing. Especially on the East and West Coast. Show voters action before Nov. 3, and tell them the truth: none of these barrels arrive by Election Day. A restart like St. Croix might come in 2027 if the financing comes through, and the new Brownsville refinery not until 2028-29. Stu will cover this on Tuesday’s Energy News Beat Stand Up, and these are his prep notes for the show. |
What the DPA can and cannot do
As of 8:15 p.m. CT Saturday. No new directive had been published on whitehouse.gov.
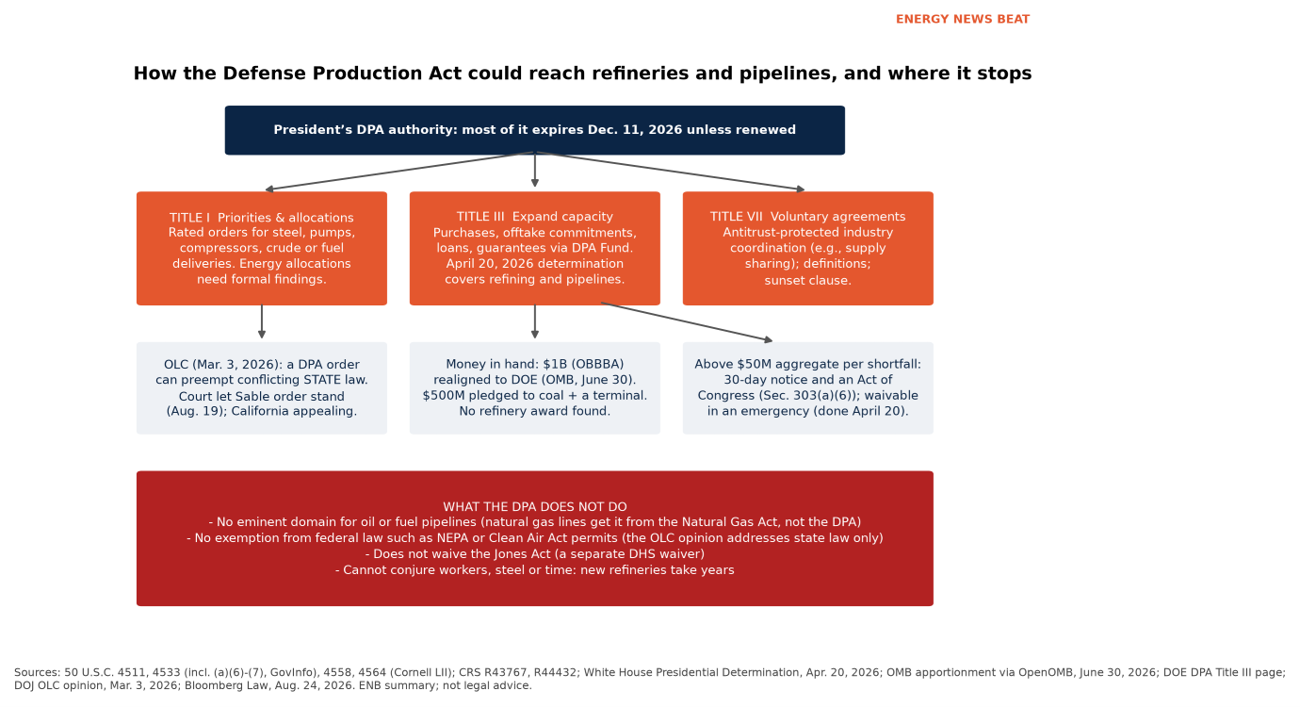
Most people do not realize the President already has the paperwork. On April 20 he signed a determination under Section 303 of the DPA covering “Domestic Petroleum Production, Refining, and Logistics Capacity.” It reaches refining, pipelines, storage and marine terminals. It directs the Energy Secretary to use “necessary purchases, commitments, and financial instruments.” It also waives the usual Title III conditions by pointing to the national energy emergency (White House; Federal Register). Chart 1 maps how it works.
There are three main tools. Title I lets the government put rated orders at the front of the line, but energy allocations need formal findings that a material is “scarce, critical, and essential” (50 U.S.C. 4511). Title III pays for new capacity through purchases, purchase commitments, loans and guarantees. Under Section 303(a)(6), once actions for a shortfall would push the aggregate outstanding amount above $50 million, the President must wait 30 days after notifying the House and Senate banking committees. Separately, for an industrial resource shortfall, no action above that same $50 million may be taken “unless such action or actions are authorized to exceed such amount by an Act of Congress.” Section 303(a)(7) lets the President waive both rules during a national emergency, and the April determination did (50 U.S.C. 4533(a)(6)-(7), GovInfo; Cornell LII). Title VII allows voluntary industry agreements with antitrust protection (50 U.S.C. 4558; CRS).
The money is real but small. The One Big Beautiful Bill put $1 billion into the DPA. OMB records show the full $1 billion moved to the Energy Department after the April determinations (OpenOMB). DOE then offered up to $500 million of Title III money to 13 coal plants and new coal export infrastructure (DOE). ENB found no refinery award. Reuters reported in September that the DPA “has never been used to add refining capacity” (Reuters via Yahoo).
The courts are the wild card. In March, the Justice Department’s Office of Legal Counsel said a DPA order can preempt conflicting state law (OLC). It did not address federal laws such as NEPA (National Law Review). On Aug. 19, a federal judge refused California’s request to block a DPA order restarting Sable Offshore’s Santa Ynez oil system, and California is appealing (Bloomberg Law). The DPA does not give oil pipelines eminent domain. CRS notes that “no federal law broadly preempts state and local siting requirements” for oil lines (CRS R44432). It also does not waive the Jones Act, which is a separate decision.
And the clock is short. Congress extended most DPA authorities only to Dec. 11, 2026, in the stopgap funding law signed Sept. 2 (Cornell LII, 50 U.S.C. 4564; Senate text, Sec. 2004; CRS). A five-year renewal, H.R. 7688, cleared the House Financial Services Committee 41-0 but has not had a floor vote (House report; Congress.gov).
The 1977 claim, checked
As of 8:15 p.m. CT Saturday
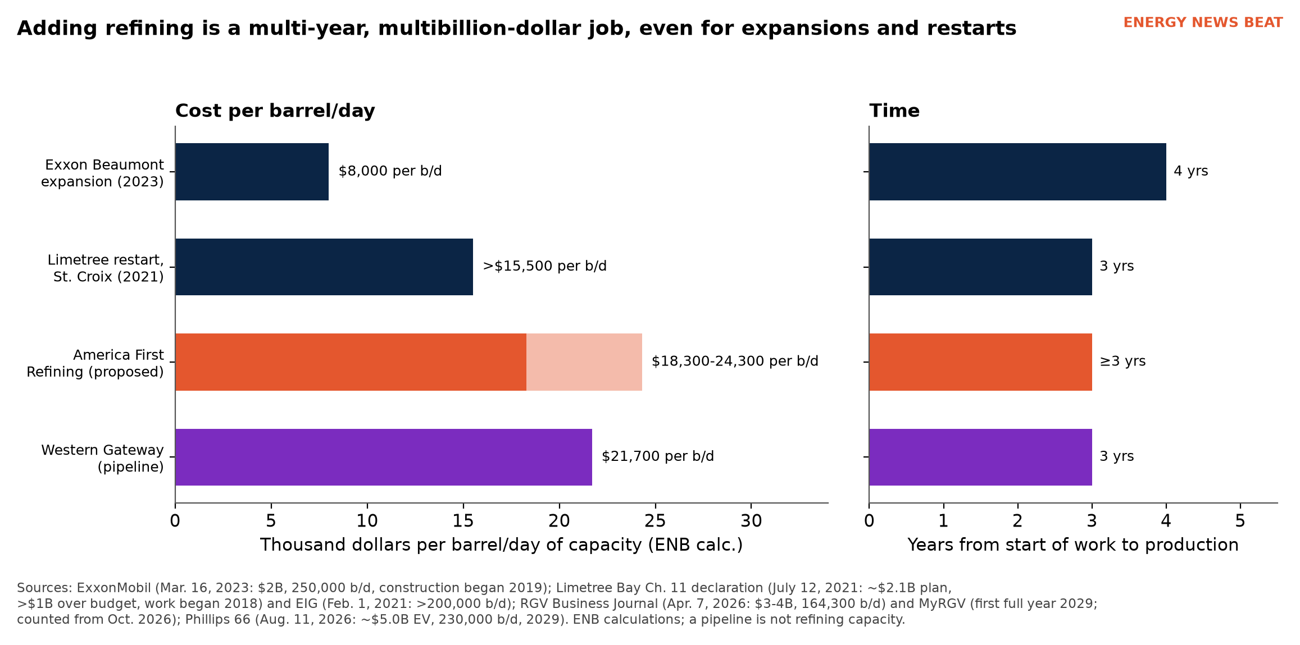
EIA says the newest U.S. refinery with significant downstream units is Marathon’s Garyville, La., plant, which came online in 1977. The newest refinery of any size is a 45,000-b/d Galveston plant that started in 2022 (EIA). The project people mean by “first since 1977” is America First Refining at the Port of Brownsville, Texas (Energy Digital). It is rated at 164,300 b/d by the RGV Business Journal and 168,000 b/d by Reuters, at a cost of $3 billion to $4 billion (RGVBJ; Reuters via Yahoo). That works out to about $18,000 to $24,000 per barrel of daily capacity (ENB calculation).
It has Fluor doing front-end engineering and tank design under way (Construction Review Online). But ENB found no publicly announced final investment decision (the CEO says one was made internally), and its 650-mile crude pipeline from the Permian “has yet to be built” (RGVBJ). Industrial Info Resources rates it a “low probability of moving forward as planned.” The CEO told the Brownsville Herald the plant should be “mechanically complete” in late 2028, with its first full year in 2029 (MyRGV). Reuters reports Donald Trump Jr. is a passive minority investor and that Cantor Fitzgerald advises the company (Reuters via Yahoo).
Where the barrels could come from
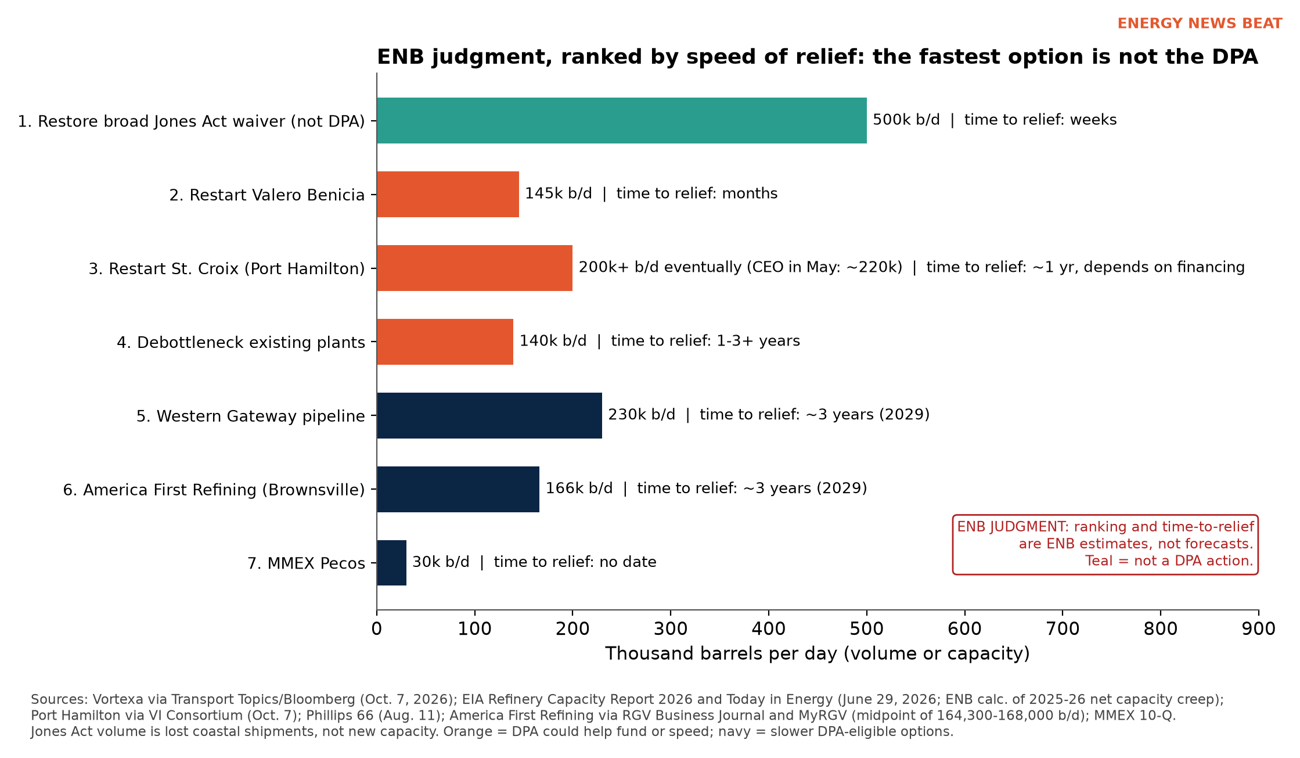
As of 8:15 p.m. CT Saturday. Rankings are ENB judgment, not forecasts.
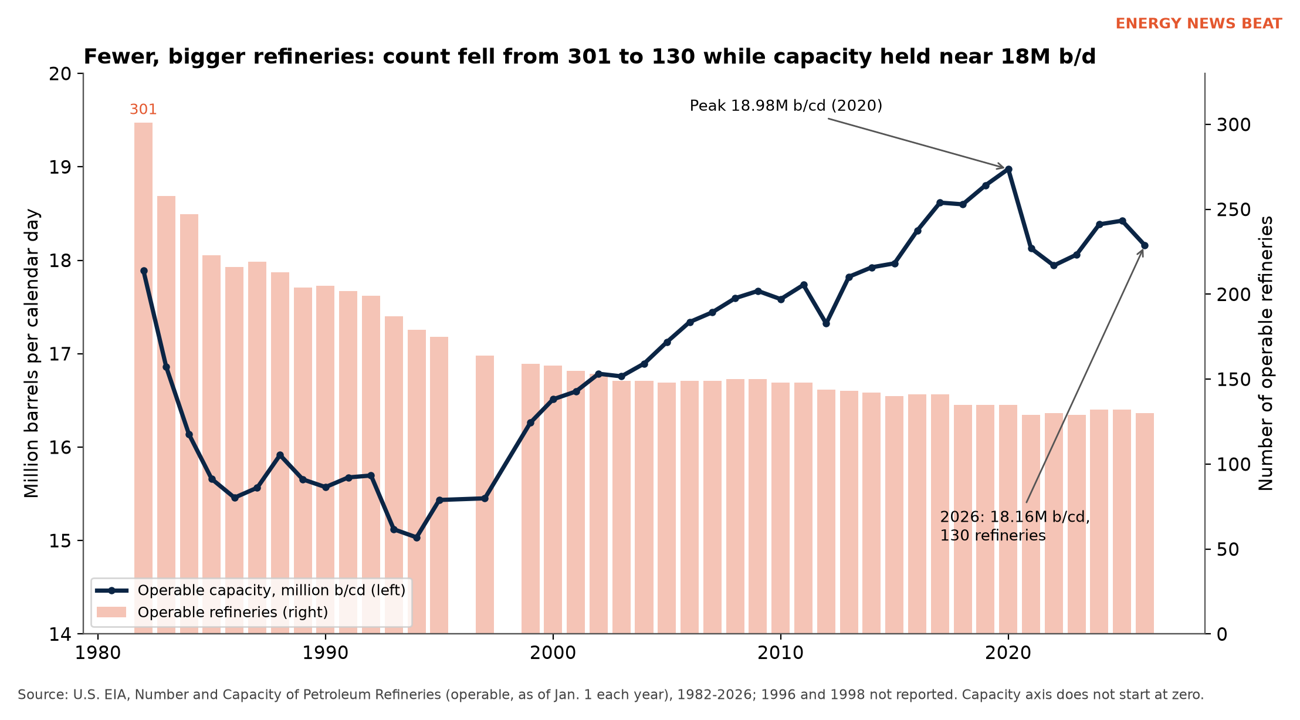
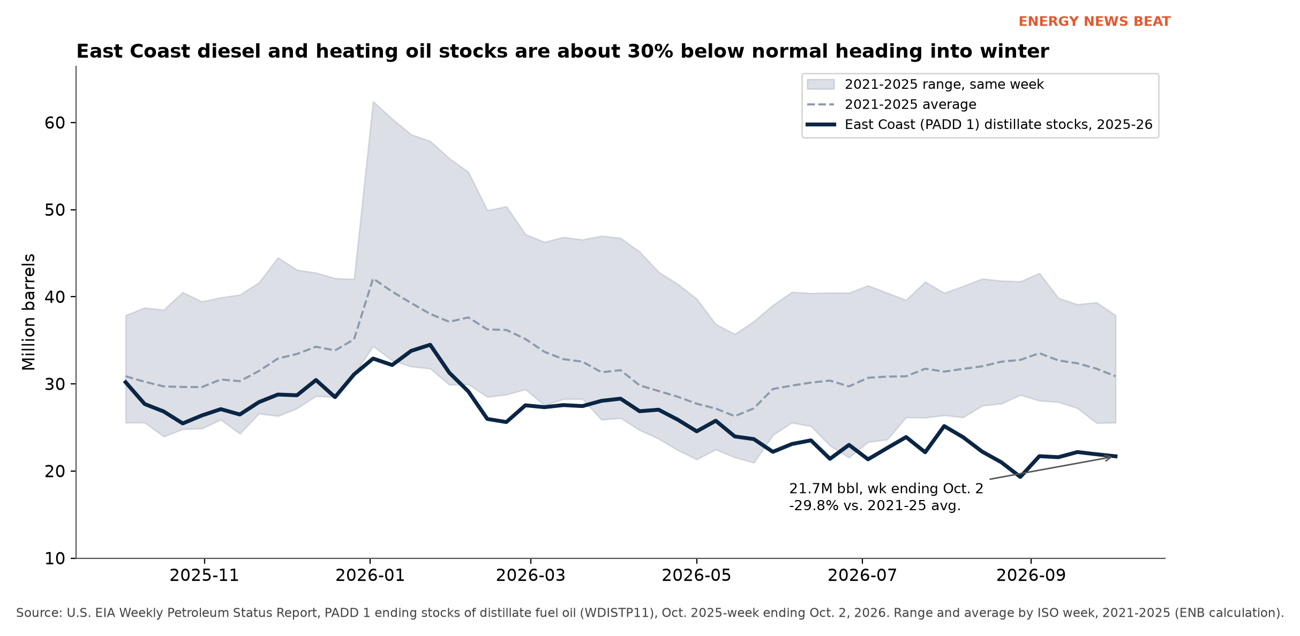
The country has 130 operable refineries, down from 301 in 1982. Capacity fell about 1% to 18.16 million b/cd on Jan. 1 (EIA; EIA; Chart 3). The squeeze is regional. PADD 1, the East Coast, has just 5% of U.S. capacity (EIA Refinery Capacity Report). Florida has no refineries and no direct link to the Colonial or Plantation pipelines (EIA). Space on Colonial is “fully allocated” (Argus). East Coast distillate stocks are 29.8% below their 2021-25 average for this week (EIA; Chart 4). The West Coast has “relatively little pipeline capacity” from the Gulf (EIA).
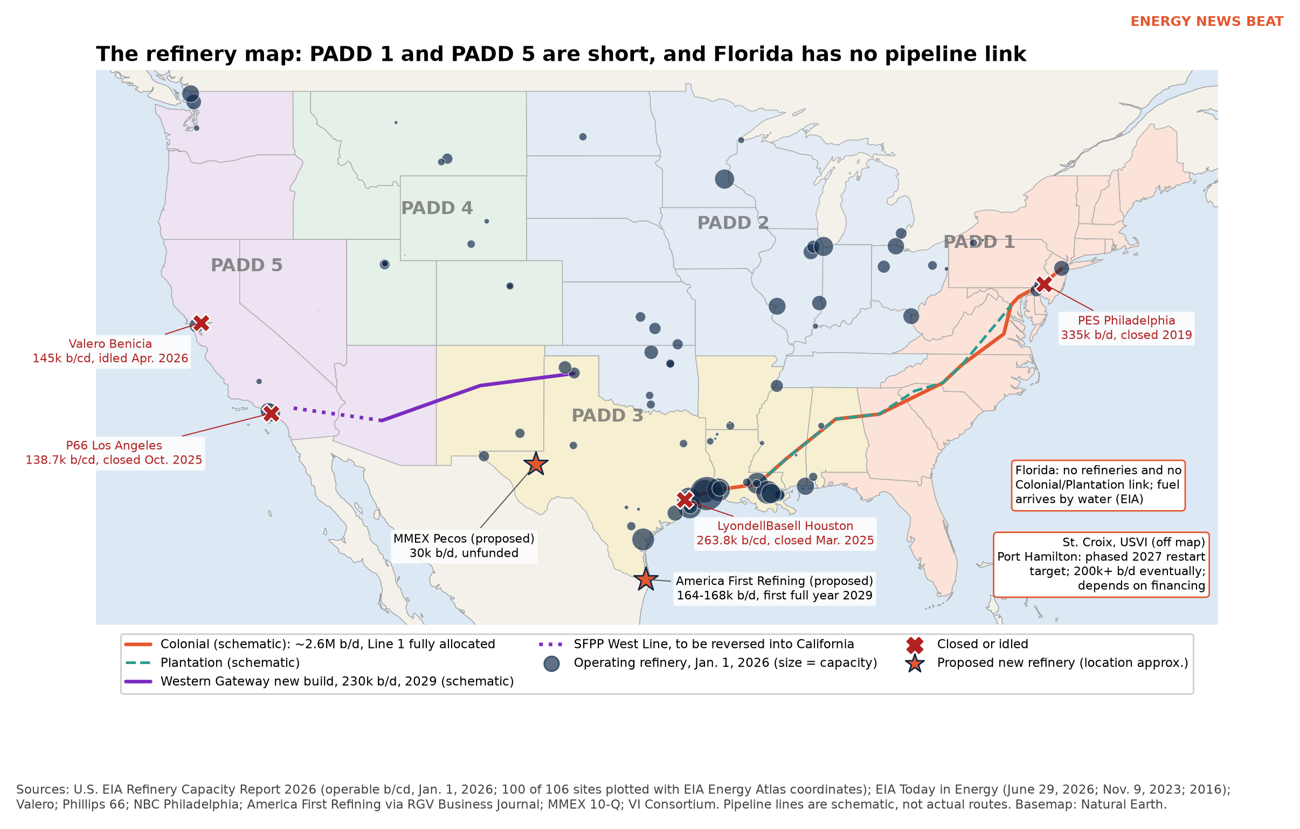
ENB looked at every closed plant and new project that could matter (Appendix D):
- Valero Benicia, Calif. (145,000 b/cd). Valero finished idling it in April and says it will “maintain all required operating permits” (Valero; EIA). It is the fastest physical restart on paper, but the owner has not proposed one.
- Croix, U.S. Virgin Islands (more than 200,000 b/d eventually; about 220,000 per the CEO in May). Port Hamilton is targeting a phased 2027 restart within about 12 months, depending on financing (VI Consortium). Politico reported it is on a White House “short list” (Politico via Yahoo). The last restart there took from 2018 to February 2021, ran “more than $1 billion over-budget” on a $2.1 billion plan, and stopped after an EPA order in May 2021 (court filing).
- Western Gateway pipeline (230,000 b/d). It would carry fuel from Borger, Texas, to Phoenix and into California. The owners took the final investment decision Aug. 11 and target 2029 (Phillips 66).
- Not coming back: LyondellBasell Houston (263,776 b/cd), where the coker units were imploded in April (KPRC); Phillips 66 Los Angeles (138,700 b/cd), closed in October 2025 (EIA); Philadelphia Energy Solutions (335,000 b/d), now being redeveloped (NBC Philadelphia); and the Rodeo and Martinez plants, converted to renewable fuels (Oil & Gas Journal).
Expanding plants that already exist is cheaper, but it is not fast. Exxon’s Beaumont expansion added 250,000 b/d for $2 billion, about $8,000 per b/d (ENB calculation). Construction started in 2019 and the expansion opened in 2023 (ExxonMobil; Chart 6). Valero’s operating chief, Gary Simmons, said in July that “the cost of some of this new capacity has been… very, very high” (Motley Fool transcript).
The other levers, and what they deliver
As of 8:15 p.m. CT Saturday
- Jones Act. The waiver runs through Nov. 15, but since Aug. 17 each voyage must first show no U.S.-flag ship is available (gCaptain). Since then, Gulf shipments to the East and West coasts “have fallen by over 500,000 barrels a day,” per Vortexa, with just nine foreign-flag energy cargoes (Transport Topics/Bloomberg). Simmons called the waiver “very critical to keeping PADD 1 supplied” (Motley Fool transcript). In ENB’s judgment, this is the fastest lever on the table.
- The reserve is down to 283.0 million barrels, the lowest since 1982 (EIA). DOE offered up to 40 million more barrels in a Sept. 29 exchange (Morning Overview) and approved a 4 million-barrel hurricane exchange on Saturday (DOE). But the SPR holds crude, and refineries are already running at 92.7% (EIA).
- Fuel waivers. EPA allowed E15 nationwide and an early start to winter-grade gasoline (EPA). That helps gasoline at the margin, not diesel.
- Export ban. On Oct. 2 Trump said, “we’re not going to be doing the export ban,” after the G7 agreed to release oil (Transport Topics/Bloomberg).
- Taxes and red-dyed diesel. An Oct. 5 order allows dyed diesel on highways and defers the federal excise tax through year-end (White House). OOIDA called it “minimal relief” (Truckers News). A House gas-tax holiday bill has stalled (Roll Call).
Is demand destruction already doing the job?
As of EIA weekly data through week ending Oct. 2, released Oct. 7
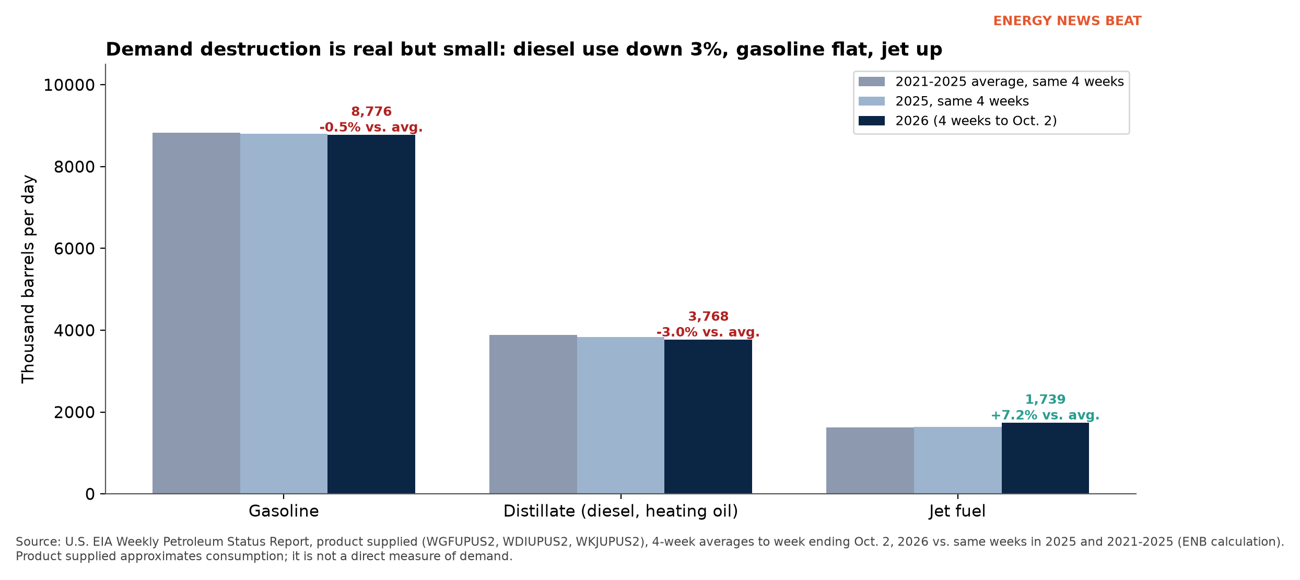
A little. Over the last four weeks, distillate use was 3.0% below the 2021-25 average and gasoline was 0.5% below. Jet fuel was 7.2% above (EIA; Chart 7; ENB recession analysis). Analyst Tom Kloza told CNN this summer’s gasoline demand will probably be the lowest since 2001, leaving out the pandemic. He called diesel margins near $100 a barrel “out of the galaxy” (CNN via KRDO).
EIA’s October outlook expects diesel to average $4.49 in 2027, down from $6.27 this month. It sees gasoline at $3.57 next year (EIA STEO). If that is right, prices fall well before any new refinery opens. That is the strongest argument against a big greenfield bet.
The case against
John Auers of Novi Labs told CNN that even a shovel-ready refinery means “four to five years until it’s going to start producing.” He asked, “What’s the Strait of Hormuz going to look like in four to five years?” (CNN via KRDO). Refiners told the White House the money would be better spent on efficiency and expanding existing plants (Reuters via Yahoo). Critics also point to the Brownsville investor ties (Reuters via Yahoo). And the DPA has a slow track record. Biden used it for heat pumps and solar in June 2022 (American Presidency Project), and the first heat-pump awards, $169 million, did not come until November 2023 (The Verge).
How consumers and investors see it
As of 8:15 p.m. CT Saturday (AAA); polls as dated
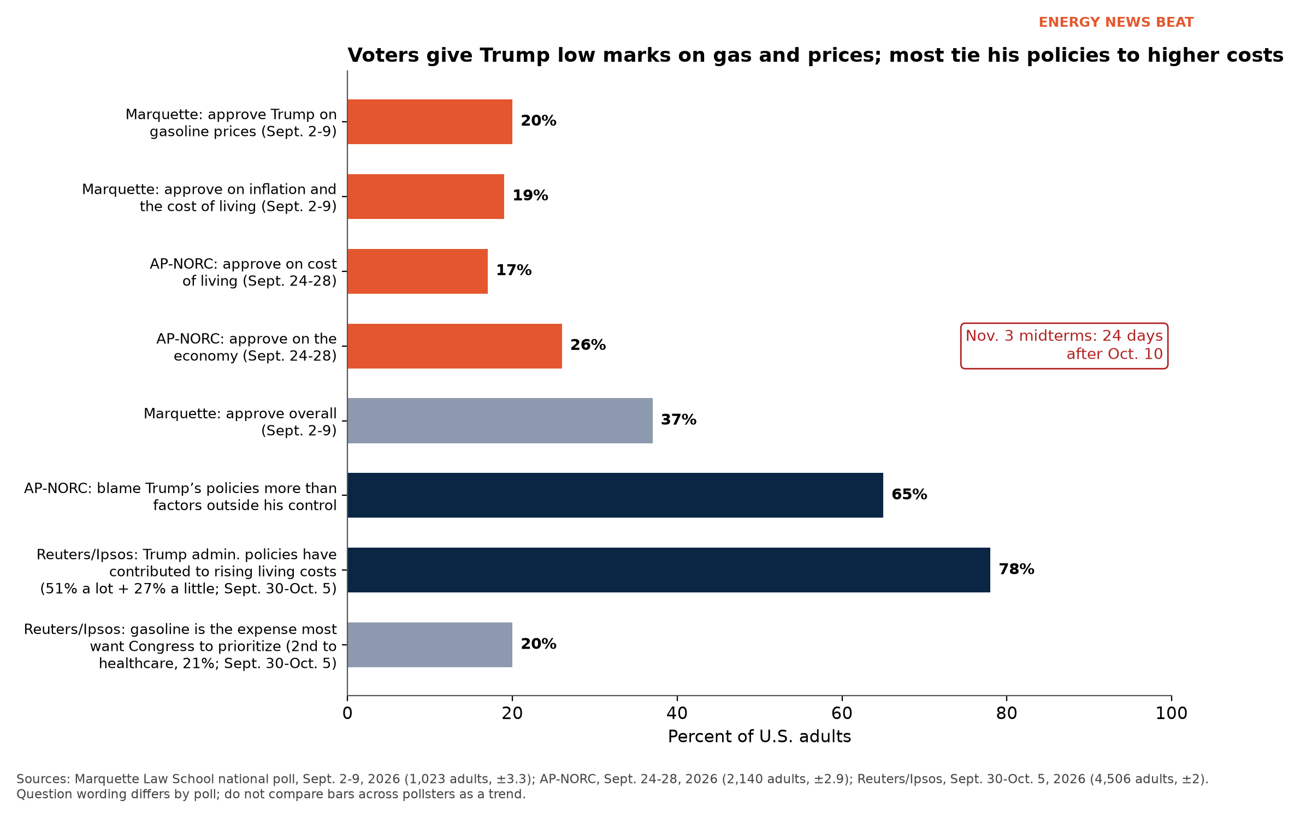
Consumers. Regular gasoline averaged $4.37 on Saturday, up from $3.10 a year ago (AAA). In the AP-NORC poll, about half of adults are “extremely” or “very” concerned about affording gas, up from 39% in July. Only 17% approve of Trump on the cost of living (AP). Marquette’s September poll found just 20% approve of his handling of gasoline prices (Marquette toplines). In Reuters/Ipsos, 78% say the Trump administration’s policies have contributed to rising living costs (51% a lot, 27% a little), and 20% pick gasoline as the expense they most want Congress to prioritize, second to healthcare at 21% (Ipsos topline; U.S. News/Reuters; Chart 8). In AP-NORC, 65% blame Trump’s policies more than factors outside his control for persistently high costs (AP). Farm Bureau President Zippy Duvall welcomed the dyed-diesel order: “every cent per gallon matters” (AFBF).
Investors. Refiners have been the market’s big winners. From Dec. 31 through Oct. 9, Valero rose 166%, Marathon 180%, Phillips 66 116%, PBF 211% and HF Sinclair 163%, against 14% for the S&P 500 (Yahoo Finance). That is because diesel margins are about $92 to $101 a barrel over Brent (ENB calculation from PFL and CNBC futures). For investors, DPA-funded rivals or offtake deals would be a long-term risk to those margins, but they will not change the next two quarters. Restarted capacity that sells to the government could be a win for whoever owns it.
Where the refineries went, and why you feel it at the pump
As of 9:31 p.m. CT Saturday (AAA state prices); EIA data as of Jan. 1, 2026
On Jan. 1, EIA counted 130 operable refineries, down from 301 in 1982. Capacity was 18.16 million b/cd, down 263,000 from a year earlier. That is 1.4%, which EIA rounds to “about 1%” (EIA; EIA). The survivors got bigger: the average plant went from about 59,000 b/d to 140,000 (ENB calculation).
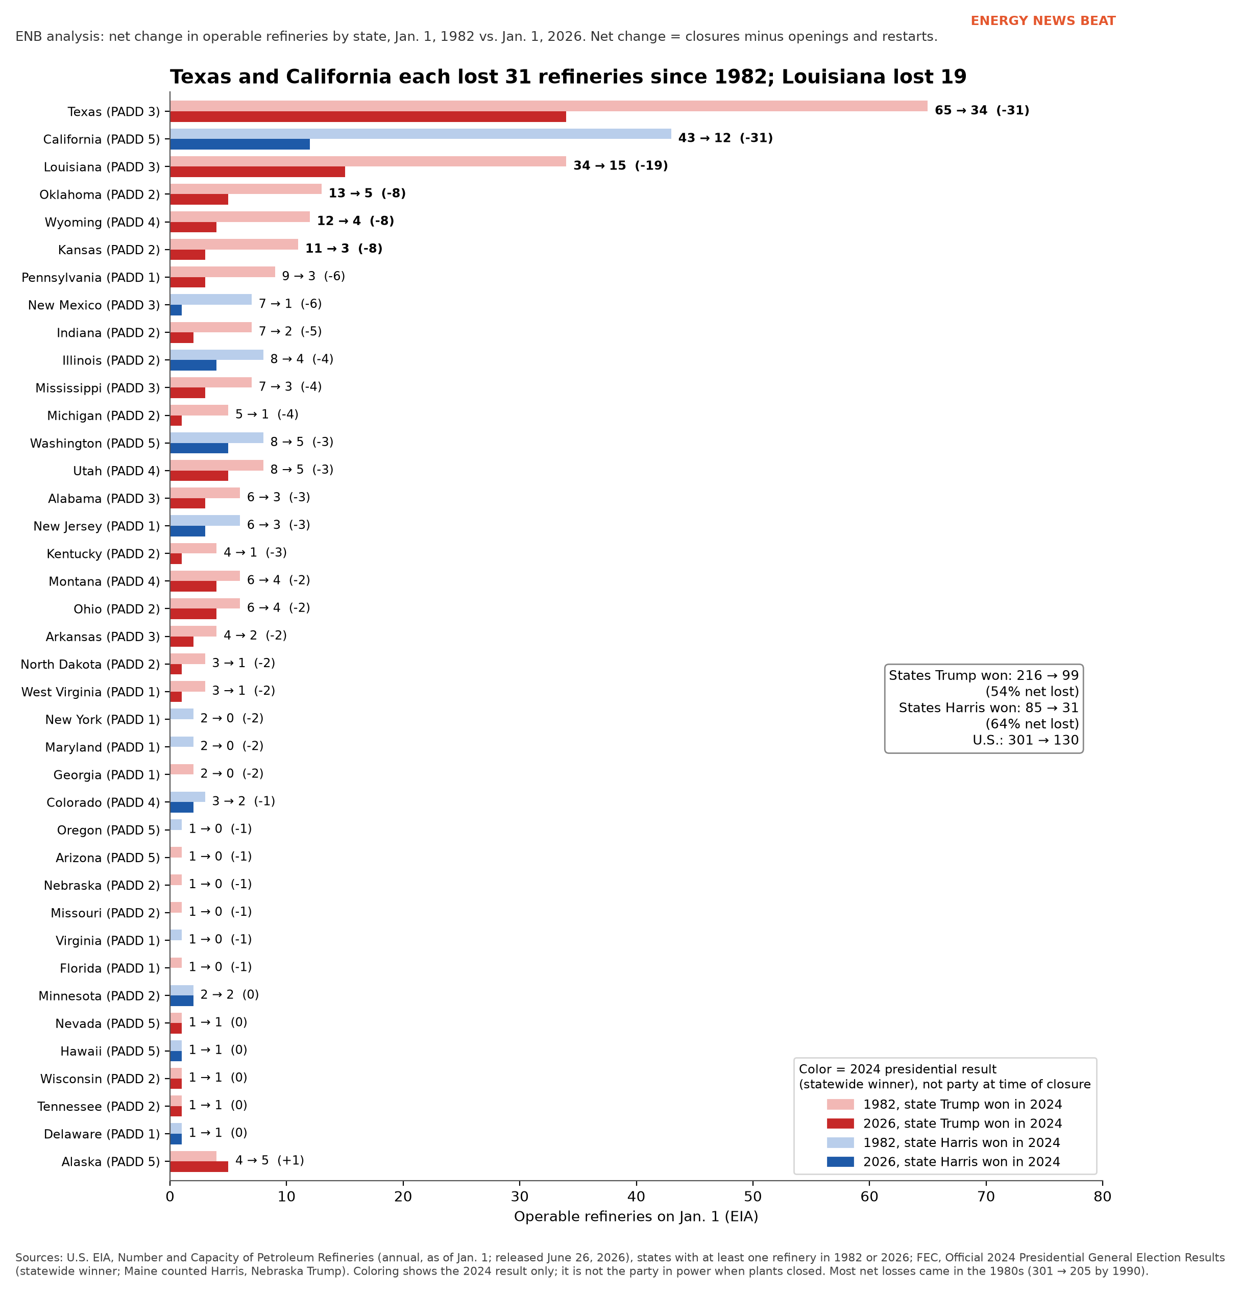
Which states lost the most (ENB analysis). Between 1982 and 2026, Texas and California each had 31 fewer refineries. Louisiana lost 19; Oklahoma, Wyoming and Kansas 8 each (Chart 9). These are net counts, closures minus openings. By 2024 vote, states Trump won lost 54% of their refineries and states Harris won lost 64% (FEC). Capacity split more sharply. Texas and Louisiana added about 1.6 million b/d, while California’s capacity fell 41%.
For party control at the time of closing, ENB matched EIA’s dated list of permanent shutdowns since 1990 (EIA) to Ballotpedia’s trifecta history, which starts in 1992 (Ballotpedia). Of 80 closures in the 50 states from 1990 through 2025, 38 came under divided government, 17 under Republican trifectas and 13 under Democratic ones; 12 are earlier or undated. Per 100 refinery-years, that is 1.7, 1.0 and 1.1. Handle with care. Texas is 37% of the Republican exposure and California 31% of the Democratic. Most losses came earlier still: 96 plants vanished in 1982-90, after price controls and small-refiner subsidies ended (EPRINC). Plant size, coastal crude costs, environmental rules and renewable conversions matter too. Party is a lens, not a cause.
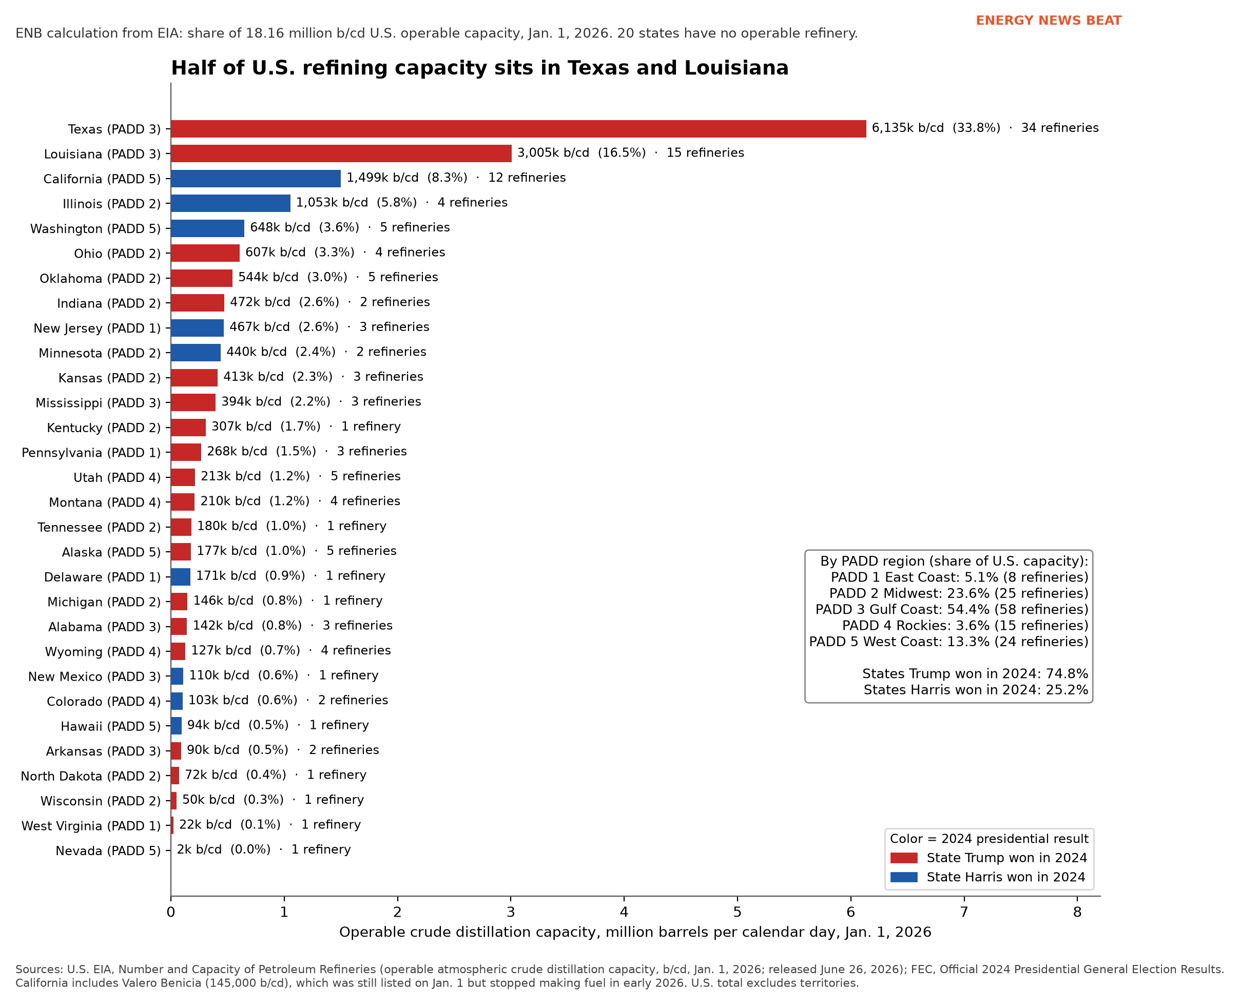
Where the barrels are now. The Gulf Coast holds 54.4% of capacity: Texas 33.8%, Louisiana 16.5%. Next come California (8.3%), Illinois (5.8%) and Washington (3.6%) (Chart 10). States Trump won hold 74.8%; states Harris won 25.2%.
California, checked. The state lists 11 crude refineries, and 7 make California-grade gasoline (CEC). EIA counted 12 because Benicia, which has since stopped making fuel, was still on its Jan. 1 list (Valero). ENB found two announced closures, Phillips 66 Los Angeles and Benicia, plus the earlier renewable conversions at Rodeo and Martinez (Table 1).
Table 1. California refineries: status as of Oct. 10, 2026
| Plant | Type | Crude capacity (b/d) | CARB gasoline? | Status | Source |
| Marathon Los Angeles (Carson/Wilmington) | Fuels refinery | 365,000 | Yes | On CEC list (data as of July 8, 2026) | CEC; EIA |
| Chevron El Segundo | Fuels refinery | 269,000 (EIA: 285,000) | Yes | On CEC list | CEC; EIA |
| Chevron Richmond | Fuels refinery | 245,271 | Yes | On CEC list | CEC; EIA |
| PBF Torrance | Fuels refinery | 160,000 | Yes | On CEC list | CEC; EIA |
| PBF Martinez | Fuels refinery | 156,400 | Yes | On CEC list | CEC; EIA |
| Valero Wilmington | Fuels refinery | 85,000 | Yes | On CEC list; operations “remain unchanged” (Governor, Jan. 6) | CEC; Governor |
| Kern Energy, Bakersfield | Small fuels refinery | 26,000 | Yes | On CEC list | CEC; EIA |
| San Joaquin Refining, Bakersfield | Small refinery | 15,000 | No (CARB diesel: yes) | On CEC list | CEC; EIA |
| Lunday Thagard, South Gate | Small refinery | 8,500 | No | On CEC list | CEC; EIA |
| Valero Wilmington Asphalt | Asphalt plant | 6,300 | No | On CEC list | CEC; EIA |
| Talley Asphalt, Kern | Asphalt plant | 1,700 | No | On CEC list | CEC; EIA |
| Valero Benicia | Fuels refinery (closed) | 145,000 (EIA, Jan. 1, 2026) | No longer | Fuel units ceased in Q1 2026; full idling completed April 2026; permits kept; not on CEC list | Valero; Argus; EIA |
| Phillips 66 Los Angeles | Fuels refinery (closed) | 138,700 (EIA) | No longer | Final crude processing expected around Oct. 16, 2025; units idled through end of 2025 | Phillips 66; EIA |
| Phillips 66 Rodeo | Converted to renewable fuels | 58,200 before shutdown (EIA Table 13) | No | Crude processing eliminated; converted to renewable fuels (OGJ, Apr. 2, 2024; EIA Table 13) | OGJ; EIA |
| Marathon Martinez | Converted to renewable fuels | 161,000 before shutdown (EIA Table 13, listed as Tesoro) | No | Idled in 2020; county approved renewable-fuels conversion May 2022; EIA: converted to renewable diesel | OGJ; EIA |
Note: capacity is crude distillation, not gasoline output. Sources: CEC (data as of July 8, 2026); EIA; company statements; Argus; OGJ.
Why it shows up at the pump. On Saturday, regular gas was $6.31 in California and $3.84 in Texas, against $4.37 nationally (AAA). EIA says few refineries make California’s unique blend, its tax is higher, and replacement supply “can still take a relatively long time to arrive” (EIA). The East Coast, with 8 refineries and 5.1% of capacity, leans on Gulf pipelines and ships (Argus). A nearby refinery is no guarantee: Washington has five and paid $5.46. But in a squeeze, families far from refineries wait longest for relief.
Corrections to early reports
As of 8:15 p.m. CT Saturday
- “The first new refinery since 1977 comes online next year.” It does not check out. The developer targets mechanical completion in late 2028 and a first full year in 2029, and ENB found no publicly announced FID; the CEO says one was made internally “a few years ago” (MyRGV). “First since 1977” holds only for a large, complex plant. EIA lists a 45,000-b/d Galveston refinery from 2022 as the newest (EIA).
- “Trump invoked the DPA for refineries on Friday.” Not as of Saturday night. Reuters reported a coming directive (Reuters via Kitco). The refining determination itself dates to April 20 (White House).
- “The DPA has fixed fuel shortages before.” Reuters says it has never been used to add refining capacity (Reuters via Yahoo). One earlier energy use, in 2001, was natural gas procurement for utilities facing blackouts (CRS).
- “Reliance signed a 20-year deal for the Brownsville refinery’s output.” Reuters reports a 20-year deal. RGV Business Journal says neither company confirmed it, and the CEO said Reliance will “buy a little bit of product” (RGVBJ).
- “20% approve of Trump on gas prices.” This checks out, but it comes from Marquette’s Sept. 2-9 poll, not an October poll (Marquette).
What to watch
- The text of any presidential DPA memo, and whether it names refineries, pipelines or the Jones Act.
- Any DOE Title III award or offtake contract for St. Croix or Benicia.
- A Senate or House floor vote to renew the DPA before Dec. 11.
- The Jones Act waiver decision before Nov. 15, and the Ninth Circuit ruling in the Sable case.
A downloadable data file with the refinery candidates, pipeline and lever tables, polls, EIA series and ENB’s calculations is available with this post. See also our earlier look at why the refinery shortage is the fear that sticks and our Russian diesel deal report.
Check out the World’s Greatest Podcast Show Notes at EnergyNewsBeat.co or EnergyNewsBeat.com. And subscribe to: The Energy News Beat Substack.
Appendices
At Energy News Beat we Make Appendices Great Again. Times are U.S. Central (CDT, UTC−5). Fast-moving items (prices, policy status) are current as of 8:15 p.m. CT, Sat., Oct. 10, 2026. Labels: [ENB JUDGMENT] = Energy News Beat assessment, not a forecast; [ENB CALC] = arithmetic by ENB from cited figures; [CLAIM] = a party’s statement not independently verified; [OPINION] = Stu’s view.
Appendix A. Sources (titled and dated)
Appendix B. Key figures
| Item | Figure | Source |
| AAA national average, Oct. 10 | Regular $4.3669 (yesterday $4.3718; week ago $4.3807; month ago $4.2770; year ago $3.1005). Diesel $6.2824 (yesterday $6.2785; week ago $6.3554; month ago $5.9773; year ago $3.6732); record $6.5276 on 9/22/26 | AAA |
| Diesel since Iran war began Feb. 28 | Up 70% | Reuters via MarketScreener |
| Days to midterms | 24 (Oct. 10 to Nov. 3) [ENB CALC] | — |
| DPA sunset | Dec. 11, 2026 (62 days after Oct. 10) for most of Titles I and III and Title VII; §§4514, 4557, 4558, 4565 excepted | 50 U.S.C. 4564; CRS IN12484 |
| DPA money | $1B appropriated (P.L. 119-21); full $1B realigned to DOE (OMB, June 30, 2026); DOE offered up to $500M ($425M for 12 coal projects, $75M West Gateway Terminal) | OpenOMB; DOE |
| Refinery DPA awards | None found by ENB | — |
| U.S. refining, Jan. 1, 2026 | 130 operable refineries (132 in 2025); 18,160,493 b/cd vs. 18,423,493 in 2025: down 263,000 b/cd, or 1.4% [ENB CALC] (EIA: “down over 250,000 b/cd (about 1%)”); peak 18.98M b/cd in 2020; 301 refineries in 1982 | EIA; EIA; EIA state series |
| Refineries lost by state, 1982-2026 (net) | Texas 65→34 (−31, Trump 2024); California 43→12 (−31, Harris); Louisiana 34→15 (−19, Trump); Oklahoma 13→5, Wyoming 12→4, Kansas 11→3 (−8 each, Trump); Pennsylvania 9→3 (−6, Trump); New Mexico 7→1 (−6, Harris) [ENB ANALYSIS] | EIA state series; FEC |
| By 2024 result | States Trump won: 216→99 refineries (54.2% net lost); states Harris won: 85→31 (63.5%) [ENB CALC] | EIA state series; FEC |
| Capacity change, 1982-2026 | Texas +21.1% (5.07M→6.13M b/cd); Louisiana +19.9% (2.51M→3.01M); together +1.57M b/cd; California −40.9% (2.53M→1.50M) [ENB CALC] | EIA state series |
| Share of 2026 capacity | Texas 33.8%; Louisiana 16.5%; California 8.3%; Illinois 5.8%; Washington 3.6%. PADD 1 5.1%, PADD 2 23.6%, PADD 3 54.4%, PADD 4 3.6%, PADD 5 13.3%. States Trump won 74.8%; Harris 25.2% [ENB CALC] | EIA state series; FEC |
| Average refinery size | ~59,400 b/cd in 1982 (17.89M ÷ 301); ~139,700 in 2026 (18.16M ÷ 130) [ENB CALC] | EIA |
| U.S. net loss by period | 1982-90: 301→205 (−96); 1990-2000: −47; 2000-10: −10; 2010-20: −13; 2020-26: −5 [ENB CALC] | EIA; EPRINC |
| Shutdowns by party control, 1990-2025 (view b) | 80 state refineries on EIA’s permanent-shutdown list: divided government 38 (1.74 per 100 refinery-years); Republican trifecta 17 (0.95); Democratic trifecta 13 (1.13); before 1992 7; no date 5 [ENB ANALYSIS] | EIA Table 13; Ballotpedia |
| California refineries | CEC (data as of July 8, 2026): 11 crude refineries, 1,338,171 b/d; 7 make CARB gasoline. EIA Jan. 1, 2026: 12 (incl. Benicia). Announced closures found: Phillips 66 Los Angeles (2025), Valero Benicia (2026) | CEC; EIA; Valero |
| AAA state averages, Oct. 10 (checked 9:31 p.m. CT) | Regular: California $6.3148; Texas $3.8359; Washington $5.4565; national $4.3669. Diesel: California $8.3884; Texas $5.6890; national $6.2824 | AAA |
| Regional share | PADD 1: 928,300 b/cd (5.1%); PADD 5: 2,419,871 (13.3%); PADD 3: 9,876,563 (54.4%) [ENB CALC from EIA list] | EIA Refinery Capacity Report |
| Closures | LyondellBasell Houston 263,776 b/cd (Mar. 2025); Phillips 66 Los Angeles 138,700 b/cd (Oct. 2025); Valero Benicia 145,000 b/cd (idled Apr. 2026) | EIA; Valero |
| Net creep at other plants | ~139,500 b/cd, 2025-26 [ENB CALC: −263,000 net change + 402,476 closed] | EIA; EIA |
| Utilization | 92.7% week ending Oct. 2; 2026 peak 98.0% (week ending 2026-08-28) | EIA |
| PADD 1 distillate | 21.687M bbl week ending Oct. 2; 2021-25 same-week average 30.873M; −29.8% [ENB CALC] | EIA |
| SPR | 283.0M bbl week ending Oct. 2; lowest since week of Oct. 15, 1982 (280.8M) | EIA |
| Product supplied (4-wk avg to Oct. 2) | Gasoline 8,776 kb/d (−0.5% vs. 2021-25); distillate 3,768 (−3.0%); jet 1,739 (+7.2%) [ENB CALC] | EIA |
| EIA STEO forecast (Oct. 2026) | Diesel $6.27 Oct. 2026 → 2027 average $4.49; gasoline $4.40 → $3.57 (avg of monthly values, ENB CALC) | EIA STEO |
| Diesel crack vs. Brent | $100.80/bbl Oct. 8; ~$91.96 Oct. 9 (ULSD $4.6828 last × 42 − Brent $104.72 settle) [ENB CALC] | CNBC; PFL |
| Refiner stocks, Dec. 31, 2025-Oct. 9, 2026 | VLO +166.4%; MPC +179.8%; PSX +115.6%; PBF +210.7%; DINO +163.2%; S&P 500 +14.1% (price change) | Yahoo Finance |
| America First Refining | 164,300 b/d (RGVBJ) or 168,000 (Reuters); $3-4B; mechanically complete late 2028, first full year 2029 (company) ; $18,300-24,300 per b/d [ENB CALC] | RGVBJ; MyRGV; Reuters |
| St. Croix | Phased 2027 restart target, within about 12 months depending on financing; more than 200,000 b/d eventually (about 220,000 per the CEO in May); prior restart: 2018-Feb. 2021, ~$2.1B plan, >$1B over budget, halted May 2021 | VI Consortium; court filing; EIG |
| Exxon Beaumont | +250,000 b/d; $2B; construction began 2019; started 2023; $8,000 per b/d [ENB CALC] | ExxonMobil |
| Western Gateway | 230,000 b/d design; ~900-mile new line Borger-Phoenix; ~$5.0B EV; target 2029 | Phillips 66 |
| Jones Act | Waiver through Nov. 15 with vessel-availability test from Aug. 17; Gulf-to-coasts shipments down >500,000 b/d since mid-Aug.; 9 foreign-flag energy cargoes | gCaptain; Transport Topics |
| Florida | Gulf gasoline shipments to Florida 187,000 b/d in August (Vortexa) | Argus |
Appendix C. DPA titles explained
| Title | What it does | What it could do for refining and pipelines | Limits |
| Title I (50 U.S.C. 4511) | Priorities and allocations: rated orders; allocate materials | Can order priority for steel, equipment, crude or fuel deliveries; energy allocations need findings that the material is “scarce, critical, and essential” and the goal “cannot reasonably be accomplished without” it | Does not grant permits, eminent domain or money; OLC (March 2026) says a DPA order can preempt conflicting state law; does not address NEPA |
| Title III (50 U.S.C. 4533) | Expand productive capacity: purchases, purchase commitments, loans, guarantees, grants via the DPA Fund | Can fund or backstop a restart, expansion or offtake; April 20, 2026 determination already covers refining, pipelines, storage and terminals | Under (a)(6), actions pushing a shortfall’s aggregate above $50M need 30-day notice to the banking committees, and (for an industrial resource shortfall) an Act of Congress above that same $50M; both waivable in a national emergency under (a)(7); money is limited: $1B realigned to DOE, $500M already pledged to coal and a terminal |
| Title VII (e.g., 4558, 4564) | Voluntary agreements with antitrust protection; general provisions and sunset | Industry coordination (e.g., supply sharing); 4558 does not sunset | Most authorities terminate Dec. 11, 2026 unless Congress acts (4564) |
Precedents: EO 14241 (Mar. 20, 2025) invoked Titles III and VII for critical minerals (CRS IN12540); Biden’s June 6, 2022 determination covered solar, transformers, heat pumps, insulation and electrolyzers, with first heat-pump awards in November 2023 (American Presidency Project; The Verge); a 2001 natural gas procurement for utilities facing blackouts (CRS R43767); Sable Offshore operational order, March 2026 (Bloomberg Law). Reauthorization: lapsed Oct.-Nov. 2025; extended to Jan. 30, 2026 (P.L. 119-37), then Sept. 30, 2026 (P.L. 119-60), then Dec. 11, 2026 (P.L. 119-103, Sec. 2004) (CRS IN12484; Cornell LII; Senate text). H.R. 7688 would extend to Sept. 30, 2031 and raise the DPA Fund cap from $750M to $2B (House report).
Appendix D. Refinery candidates
| Name | Location | PADD | Capacity | Status | Closure date | Restart feasibility [ENB JUDGMENT] | Est. time / cost | Source |
| Valero Benicia | Benicia, CA | 5 | 145,000 b/cd (EIA list, Jan. 1, 2026) | Idled; Valero says it will maintain all required operating permits | Full idling completed April 2026 | Medium-low (ENB judgment): units intact and permitted, but owner is evaluating redevelopment | Months, if the owner agreed (ENB judgment); cost not disclosed | Valero; EIA |
| Port Hamilton (ex-Hovensa/Limetree), St. Croix | St. Croix, USVI | None (USVI) | More than 200,000 b/d eventually (about 220,000 per the CEO in May) | Idle; owner targets phased 2027 restart within about 12 months, depending on financing | Halted May 2021 (EPA order) | Medium (ENB judgment): most advanced restart candidate for the East Coast/Florida by tanker | Within about 12 months, depending on financing (owner); last restart took 2018-Feb. 2021 and ran more than $1 billion over a $2.1 billion plan | VI Consortium/Bloomberg; Limetree Ch. 11 declaration |
| Phillips 66 Los Angeles | Wilmington/Carson, CA | 5 | 138,700 b/cd | Ceased operations; site redevelopment | October 2025 | Low (ENB judgment) | n/a | EIA; Phillips 66 |
| LyondellBasell Houston | Houston, TX | 3 | 263,776 b/cd | Refining ended; two coker units imploded April 12, 2026 | March 2025 | Very low (ENB judgment): key units demolished | n/a | EIA; KPRC Click2Houston |
| Philadelphia Energy Solutions | Philadelphia, PA | 1 | 335,000 b/d (former) | Being redeveloped as the Bellwether District | 2019 | None (ENB judgment): bankruptcy filing called restart a “fantasy” | n/a | NBC Philadelphia; Philadelphia Inquirer |
| Phillips 66 Rodeo | Rodeo, CA | 5 | 120,000 b/d portion converted; now >50,000 b/d renewable fuels | Crude processing eliminated | Early 2024 | Low (ENB judgment): reconversion would undo a completed project | n/a | Oil & Gas Journal |
| Marathon Martinez | Martinez, CA | 5 | Former crude refinery; now up to 730M gal/yr renewable fuels | Converted to renewable fuels | Idled 2020 | Low (ENB judgment) | n/a | Oil & Gas Journal |
| America First Refining (new) | Brownsville, TX | 3 | 164,300-168,000 b/d (sources differ) | Air permit; FEED (Fluor) under way; no publicly announced FID (CEO says one was made internally) | n/a (greenfield) | Medium-low (ENB judgment): financing and a crude pipeline not yet in place | Mechanically complete late 2028, first full year 2029 (company); $3-4 billion | RGV Business Journal; MyRGV; Reuters |
| MMEX Pecos (new) | Pecos County, TX | 3 | 30,000 b/d first train | TCEQ permit July 24, 2026; company reports going-concern doubt | n/a (greenfield) | Low (ENB judgment): no construction financing | Not disclosed | MMEX 10-Q |
| Existing plants: debottlenecking and “capacity creep” | Nationwide | All | ~139,500 b/cd net added by plants other than the two closures, 2025-2026 (ENB calc. from EIA) | Ongoing | n/a | High (ENB judgment) | 1-3+ years; Exxon Beaumont added 250,000 b/d for $2 billion (2019-2023) | EIA; ExxonMobil |
Appendix E. Pipeline bottlenecks
| Route | Link | Capacity | Status | ENB note | Source |
| Colonial Pipeline (Houston-Linden, NJ) | PADD 3 to PADD 1 | Line 1 ~1.4M b/d gasoline; Line 2 ~1.2M b/d distillates (EIA, 2016) | Line 1 fully allocated in 2026 (Argus); no expansion project found | Biggest single artery to the Southeast and Mid-Atlantic; DPA could prioritize materials, but no project exists to fund | EIA; Argus |
| Florida supply | PADD 3 to Florida by water | Florida has no refineries and no direct access to Colonial or Plantation | Relies on Jones Act tankers and barges and imports | A pipeline is not a near-term fix; vessel supply is | EIA |
| Gulf Coast to West Coast | PADD 3 to PADD 5 | “Relatively little pipeline capacity” (EIA) | West Coast relies on imports and tankers | Western Gateway is the only announced fix | EIA |
| Western Gateway Pipeline (Borger, TX-Phoenix; reversed SFPP to California) | PADD 3/4 to PADD 5 | 230,000 b/d (initial) | FID Aug. 11, 2026; completion 2029; Phillips 66 49.9%, Kinder Morgan 35.1%, HF Sinclair 15% | Already financed privately; DPA Title I priority ratings could in theory speed steel and equipment | Phillips 66 |
| Oil pipelines generally | All | n/a | “No federal law broadly preempts state and local siting requirements” for oil pipelines (CRS) | Biggest legal gap for a DPA pipeline push; natural gas lines have FERC eminent domain, oil lines do not | CRS R44432 |
Appendix F. Other levers
| Lever | Size | Time to effect | Status, Oct. 10 | ENB assessment | Source |
| Restore broad Jones Act waiver | Up to ~500,000 b/d of Gulf-to-coast shipments lost since the Aug. 17 narrowing (Vortexa via TT) | Weeks (ENB judgment) | Waiver runs through Nov. 15, now voyage-by-voyage; 9 foreign-flag energy cargoes since Aug. 17 | High for PADD 1, Florida, PADD 5 (ENB judgment) | gCaptain; Transport Topics/Bloomberg |
| SPR exchanges | Up to 40M bbl offered (Sept. 29); 4M bbl emergency exchange Oct. 10 | Weeks; crude, not fuel | SPR at 283.0M bbl, lowest since 1982; refineries already near full | Low for diesel (ENB judgment): crude is not the bottleneck | DOE; Morning Overview; EIA |
| RVP/E15 and early winter-grade waivers | Adds gasoline blending flexibility | Immediate | In place nationwide (EPA, Aug. 20) | Modest, gasoline only | EPA |
| Export restrictions | Not quantified | Immediate | Ruled out Oct. 2 after G7 deal; Wright and Burgum warned against it | Risky: could cut runs and hurt allies (ENB judgment) | Transport Topics/Bloomberg |
| Red-dyed diesel / federal tax deferral | Up to 24.4 cents/gal deferred (not forgiven) | Immediate | EO Oct. 5; OOIDA: “minimal relief” | Small, temporary | White House; Truckers News; AFBF |
| Federal gas-tax holiday | 18.4 cents/gal gasoline, 24.4 cents diesel (federal excise) | Needs Congress | House bill stalled (Roll Call, Sept. 16) | Small; does not add supply | Roll Call |
| DPA: restart/expand refining | 145,000-230,000 b/d per project | About 1-4+ years (ENB judgment) | Authority signed April 20; $1B realigned to DOE; no refinery award; DPA sunsets Dec. 11 unless renewed | Large but slow; the only lever that adds capacity | White House; OpenOMB; Cornell LII |
Appendix G. Polls
| Pollster | Field dates | Sample | MoE (pts) | Question | Result | Note |
| Marquette Law School (national) | Sept. 2-9, 2026 | 1,023 adults | ±3.3 | Approve of Trump on gasoline prices | 20% | 80% disapprove; May 19%, July 21% |
| Marquette Law School (national) | Sept. 2-9, 2026 | 1,023 adults | ±3.3 | Approve of Trump on inflation and the cost of living | 19% | May 22%, July 24% |
| Marquette Law School (national) | Sept. 2-9, 2026 | 1,023 adults | ±3.3 | Approve of Trump overall | 37% | |
| AP-NORC | Sept. 24-28, 2026 | 2,140 adults | ±2.9 | Approve of Trump on cost of living | 17% | |
| AP-NORC | Sept. 24-28, 2026 | 2,140 adults | ±2.9 | Approve of Trump on the economy | 26% | |
| AP-NORC | Sept. 24-28, 2026 | 2,140 adults | ±2.9 | Blame Trump’s policies more than factors outside his control for persistently high costs | 65% | |
| Reuters/Ipsos | Sept. 30-Oct. 5, 2026 | 4,506 adults | ±2 | Say Trump administration policies contributed to rising living costs (TM3501Y26_1) | 78% | 51% a lot, 27% a little |
| Reuters/Ipsos | Sept. 30-Oct. 5, 2026 | 4,506 adults | ±2 | Gasoline is the expense they most want Congress to prioritize (TM3329Y25) | 20% | Second to healthcare (21%); 27% of Republicans |
Marquette question wording: “Overall, how much do you approve or disapprove of the way Donald Trump is handling each of the following issues? [Gasoline prices]” — 4% strongly approve, 16% somewhat approve (Marquette toplines). Marquette trend on gasoline prices: May 19%, July 21%, Sept. 20%; on inflation and the cost of living: May 22%, July 24%, Sept. 19% (Table 17). Reuters/Ipsos items: TM3501Y26_1 asks whether “Policies and actions of the Trump Administration” have contributed to increasing the cost of living in the past year (51% a lot, 27% a little, 17% no); TM3329Y25 asks which one area of everyday expenses respondents most want Congress to prioritize (healthcare 21%, gasoline 20%, housing/rent 19%, food 17%) (Ipsos topline). AP-NORC’s 65% is comparative: blame Trump’s policies more than factors outside his control (AP). No October poll on gasoline-price approval was found.
Appendix H. Data gaps and conflicts
- Brownsville capacity. 164,300 b/d (RGV Business Journal) vs. 168,000 b/d (Reuters). Both shown.
- Reliance deal. Reuters: a 20-year deal to buy the output. RGVBJ: neither company confirmed a 20-year contract; the CEO said Reliance will “buy a little bit of product.” The FT (via MyRGV) reported a “modest initial outlay” of about $40 million.
- Benicia capacity. EIA lists 145,000 b/cd. ENB did not find a current Valero figure on restart cost or time.
- Croix capacity. The CEO spoke of about 220,000 b/d in May; the Oct. 7 story says output would “eventually exceed 200,000 barrels.” The 2027 target depends on financing.
- Brownsville FID. No publicly announced FID; the CEO told MyRGV one was made internally “a few years ago,” with a public announcement to wait until “there’s more capital under the belt.”
- Croix cost. The 2018-21 restart cost is a lower bound (>$3.1B, from a $2.1B plan plus “more than $1 billion over-budget”). ENB found no current restart budget.
- Martinez crude capacity. EIA’s permanent-shutdown table lists Martinez at 161,000 b/cd (as Tesoro Refining & Marketing), last operating in April 2020, and Rodeo at 58,200 b/cd. ENB did not find those figures in v1’s sources.
- California count. “Seven refineries” matches the CEC’s count of plants making CARB gasoline; the CEC lists 11 crude refineries in all, and EIA listed 12 on Jan. 1, 2026 (including Benicia). ENB found no announcement that five more California refineries will close.
- State closure dates. EIA’s annual state counts give net change only. EIA Table 13 dates each permanent shutdown since 1990, but nothing comparable exists for 1982-89, and Ballotpedia’s trifecta history starts in 1992.
- DPA directive. Reported by Reuters (three industry sources); not published as of 8:15 p.m. CT Oct. 10.
- R. 7688 floor action. Congress.gov blocked automated access. Committee action is from the House report.
- 100 of 106 EIA refinery sites have coordinates in the EIA Energy Atlas layer, which dates from 2017. The six unmatched sites (two Corpus Christi, Galveston, Kapolei, Kern, Newcastle) are not plotted. Pipeline lines are schematic.
- Time to relief in Chart 5 is ENB judgment. Jones Act volume is shipments lost, not new capacity.
- EIA’s Brent spot ($125.44, Oct. 6) differs sharply from the futures settle ($104.72, Oct. 9). ENB uses futures for crack spreads.
- Not read directly: Reuters, Politico and CNN originals (read through syndication: Yahoo, Kitco, MarketScreener, U.S. News, KRDO); Bloomberg (via Transport Topics and VI Consortium); FT (via MyRGV); some congress.gov pages (used EveryCRSReport and GovInfo).
Appendix I. Methods and data file
ENB calculations: cost per b/d = project cost ÷ capacity. Net capacity creep = (2026 − 2025 operable capacity) + capacity of the two 2025 closures. PADD 1 five-year range uses ISO weeks, 2021-2025. Product supplied uses four-week averages. Crack spread = ULSD futures × 42 − Brent futures. Refiner stock changes compare Yahoo Finance closes on Dec. 31, 2025 and Oct. 9, 2026. The STEO 2027 average is the mean of monthly forecasts. The ranking in Chart 5 is ENB judgment, based on the cited capacities and timelines. The downloadable data file with this post contains every chart’s data, the candidate, pipeline, lever, poll and DPA tables, the EIA snapshots and the full source list.
Appendix J. State-by-state refinery data and method [ENB ANALYSIS]
Method. (1) Counts and capacity: EIA “Number and Capacity of Petroleum Refineries,” total operable refineries and operable atmospheric crude distillation capacity (b/cd) as of Jan. 1, by state, 1982 and 2026. 1982 is the first year EIA’s state series covers. EIA publishes no 1996 or 1998 values. Net lost = 1982 count − 2026 count. The U.S. totals exclude territories, and the state rows add up to EIA’s U.S. totals (301; 130; 18,160,493 b/cd). (2) View (a): each state’s statewide 2024 presidential winner from the FEC’s official results (Maine counted Harris, Nebraska Trump). (3) View (b): each permanent shutdown in EIA Refinery Capacity Report 2026, Table 13 (1990 to Jan. 1, 2026), dated by “Date Shutdown” or, if blank, “Date of Last Operation,” and matched to the state’s trifecta status that year from Ballotpedia (1992-2026). Only plants with crude capacity in the 50 states count. Refinery-years = the sum of each state’s Jan. 1 count over 1992-2025, grouped by trifecta status that year; EIA’s 1996 and 1998 gaps are filled with the prior year. Nebraska has a nonpartisan legislature. (4) Cross-check: summing year-over-year net count declines by trifecta status gives the same order (Democratic trifecta 2.4, divided 2.3, Republican 1.2 net declines per 100 refinery-years). (5) Confounders not controlled: industry consolidation and bigger plants, the end of crude price controls and the small-refiner subsidy in 1981, coastal vs. inland crude and product costs, environmental rules, renewable-fuel conversions, and reclassifications in EIA counts. Colors in Charts 9 and 10 show the 2024 result only.
| State | PADD | 1982 | 2026 | Net lost | Cap. 1982 (b/cd) | Cap. 2026 (b/cd) | Cap. change | Share of U.S. 2026 | 2024 winner | Trifecta 2026 | AAA regular Oct. 10 |
| Texas | 3 | 65 | 34 | 31 | 5,067,748 | 6,134,650 | +21.1% | 33.8% | Trump | Republican | $3.84 |
| California | 5 | 43 | 12 | 31 | 2,534,665 | 1,499,171 | -40.9% | 8.3% | Harris | Democratic | $6.31 |
| Louisiana | 3 | 34 | 15 | 19 | 2,506,871 | 3,005,373 | +19.9% | 16.5% | Trump | Republican | $3.94 |
| Oklahoma | 2 | 13 | 5 | 8 | 566,500 | 543,800 | -4.0% | 3.0% | Trump | Republican | $4.04 |
| Wyoming | 4 | 12 | 4 | 8 | 229,735 | 127,000 | -44.7% | 0.7% | Trump | Republican | $4.50 |
| Kansas | 2 | 11 | 3 | 8 | 465,459 | 413,000 | -11.3% | 2.3% | Trump | Divided | $4.03 |
| Pennsylvania | 1 | 9 | 3 | 6 | 704,041 | 268,000 | -61.9% | 1.5% | Trump | Divided | $4.46 |
| New Mexico | 3 | 7 | 1 | 6 | 117,924 | 110,000 | -6.7% | 0.6% | Harris | Democratic | $4.43 |
| Indiana | 2 | 7 | 2 | 5 | 602,300 | 471,700 | -21.7% | 2.6% | Trump | Republican | $3.92 |
| Illinois | 2 | 8 | 4 | 4 | 1,024,300 | 1,053,023 | +2.8% | 5.8% | Harris | Democratic | $4.72 |
| Mississippi | 3 | 7 | 3 | 4 | 371,300 | 393,940 | +6.1% | 2.2% | Trump | Republican | $3.94 |
| Michigan | 2 | 5 | 1 | 4 | 128,600 | 146,000 | +13.5% | 0.8% | Trump | Divided | $4.67 |
| Utah | 4 | 8 | 5 | 3 | 166,500 | 213,089 | +28.0% | 1.2% | Trump | Republican | $4.84 |
| Washington | 5 | 8 | 5 | 3 | 387,730 | 648,200 | +67.2% | 3.6% | Harris | Democratic | $5.46 |
| New Jersey | 1 | 6 | 3 | 3 | 735,100 | 467,000 | -36.5% | 2.6% | Harris | Democratic | $4.29 |
| Alabama | 3 | 6 | 3 | 3 | 142,900 | 142,100 | -0.6% | 0.8% | Trump | Republican | $3.99 |
| Kentucky | 2 | 4 | 1 | 3 | 247,100 | 307,000 | +24.2% | 1.7% | Trump | Divided | $4.04 |
| Ohio | 2 | 6 | 4 | 2 | 543,100 | 606,600 | +11.7% | 3.3% | Trump | Republican | $3.91 |
| Montana | 4 | 6 | 4 | 2 | 154,050 | 210,000 | +36.3% | 1.2% | Trump | Republican | $4.51 |
| Arkansas | 3 | 4 | 2 | 2 | 64,200 | 90,500 | +41.0% | 0.5% | Trump | Republican | $3.97 |
| West Virginia | 1 | 3 | 1 | 2 | 22,100 | 22,300 | +0.9% | 0.1% | Trump | Republican | $4.28 |
| North Dakota | 2 | 3 | 1 | 2 | 65,250 | 72,000 | +10.3% | 0.4% | Trump | Republican | $4.15 |
| Georgia | 1 | 2 | 0 | 2 | 29,000 | 0 | -100.0% | 0.0% | Trump | Republican | $3.82 |
| Maryland | 1 | 2 | 0 | 2 | 29,200 | 0 | -100.0% | 0.0% | Harris | Democratic | $4.27 |
| New York | 1 | 2 | 0 | 2 | 97,900 | 0 | -100.0% | 0.0% | Harris | Democratic | $4.46 |
| Colorado | 4 | 3 | 2 | 1 | 84,400 | 103,000 | +22.0% | 0.6% | Harris | Democratic | $4.24 |
| Florida | 1 | 1 | 0 | 1 | 15,000 | 0 | -100.0% | 0.0% | Trump | Republican | $4.11 |
| Virginia | 1 | 1 | 0 | 1 | 53,000 | 0 | -100.0% | 0.0% | Harris | Democratic | $4.19 |
| Missouri | 2 | 1 | 0 | 1 | 104,000 | 0 | -100.0% | 0.0% | Trump | Republican | $4.01 |
| Nebraska | 2 | 1 | 0 | 1 | 5,600 | 0 | -100.0% | 0.0% | Trump | Nonpartisan legislature | $4.23 |
| Arizona | 5 | 1 | 0 | 1 | 4,015 | 0 | -100.0% | 0.0% | Trump | Divided | $4.72 |
| Oregon | 5 | 1 | 0 | 1 | 15,000 | 0 | -100.0% | 0.0% | Harris | Democratic | $5.01 |
| Minnesota | 2 | 2 | 2 | 0 | 194,443 | 440,000 | +126.3% | 2.4% | Harris | Divided | $4.27 |
| Delaware | 1 | 1 | 1 | 0 | 140,000 | 171,000 | +22.1% | 0.9% | Harris | Democratic | $4.24 |
| Tennessee | 2 | 1 | 1 | 0 | 49,500 | 180,000 | +263.6% | 1.0% | Trump | Republican | $3.95 |
| Wisconsin | 2 | 1 | 1 | 0 | 39,000 | 49,547 | +27.0% | 0.3% | Trump | Divided | $4.15 |
| Hawaii | 5 | 1 | 1 | 0 | 48,000 | 93,500 | +94.8% | 0.5% | Harris | Democratic | $5.64 |
| Nevada | 5 | 1 | 1 | 0 | 4,180 | 2,000 | -52.2% | 0.0% | Trump | Divided | $5.45 |
| Alaska | 5 | 4 | 5 | -1 | 130,023 | 177,000 | +36.1% | 1.0% | Trump | Divided | $5.02 |
View (b): EIA Table 13 permanent shutdowns (50 states, crude capacity > 0) by state trifecta status in the shutdown year.
| Party control that year | Shutdowns | Crude capacity shut (b/cd) | Refinery-years, 1992-2025 | Per 100 refinery-years | Share of shutdowns |
| Before 1992 (not covered) | 7 | 94,150 | — | — | 8.8% |
| Democratic trifecta | 13 | 569,500 | 1,149 | 1.13 | 16.2% |
| Divided | 38 | 1,940,186 | 2,179 | 1.74 | 47.5% |
| Republican trifecta | 17 | 907,841 | 1,788 | 0.95 | 21.2% |
| n/a | 5 | 38,650 | — | — | 6.2% |
Sources: EIA state series; EIA Refinery Capacity Report 2026, Table 13; FEC; Ballotpedia; AAA. The full shutdown list, the yearly net changes and every state row are in the data file.
