


A Kern County oilman briefed two Cabinet secretaries on a plan to store sunlight as heat in old California oil fields for weeks at a time. The physics is real, and a national lab study backs storage on a terawatt-hour scale. But the only funded test is a 100-kilowatt pilot, and some of the biggest numbers do not add up yet. Here is what it could mean for your power bill.
By Stuart Turley, host of the Energy News Beat podcast • Published Oct. 11, 2026 • Prices, permits and project status as of 3:00 p.m. CT, Sun., Oct. 11, 2026 • Analysis and opinion: Stu’s views are labeled • Coming up: Stu interviews Mike Umbro on the podcast this week. We will include the live video link here later in the week.
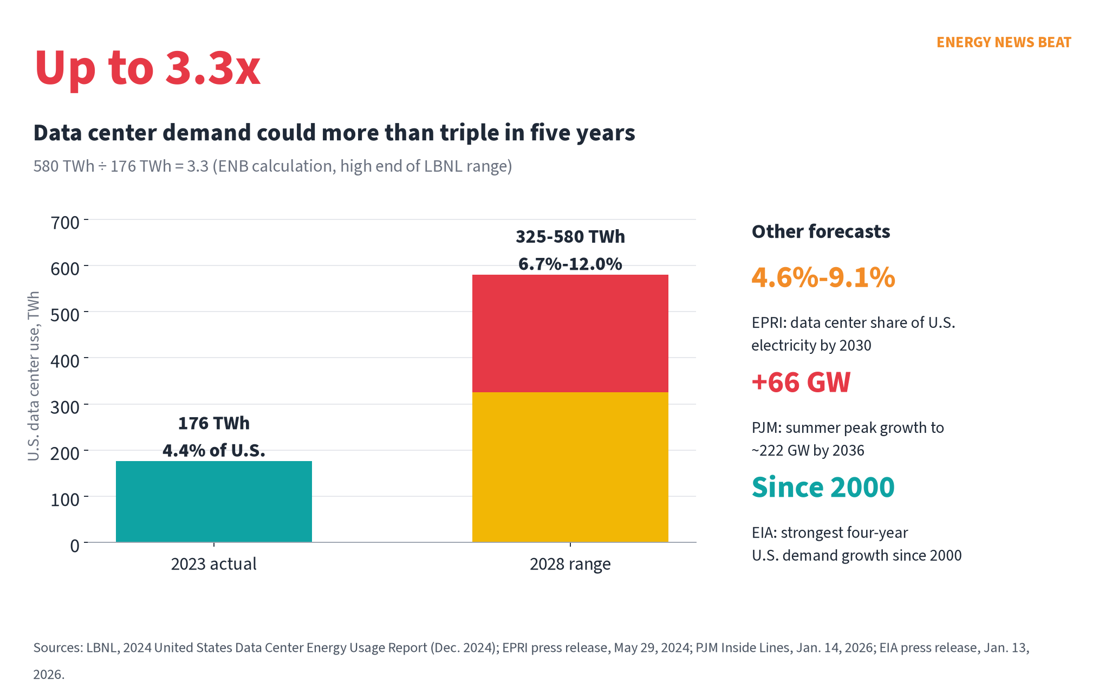
If you live in California, you already know the punch line. In July the average household there paid 33.61 cents per kilowatt-hour, against 18.31 cents for the country as a whole (EIA Electric Power Monthly). That is about 84% more (ENB calculation). Now add the data center boom. Lawrence Berkeley National Laboratory says U.S. data centers could use 6.7% to 12% of the nation’s electricity by 2028, up from 4.4% in 2023 (LBNL). In a July poll for Americans for Responsible Innovation, 77% of voters said they were concerned that data centers will drive up their bills (Morning Consult for ARI).
So when someone says the answer might be sitting under old oil fields in Kern County, it is worth a careful look. Mike Umbro, president of Premier Resource Management (PRM), says depleted sandstone reservoirs can soak up solar heat in summer and give it back as electricity at night, for days or even weeks on end. He calls it GeoTES, short for geologic thermal energy storage. Stu tells us Umbro presented the idea to Energy Secretary Chris Wright and Interior Secretary Doug Burgum. Stu sits down with Umbro on the podcast this week, and the questions we want answered are at the end of this article.
Our short answer: not a holy grail yet, but a serious idea that deserves a real test. The underlying science has national lab backing. The scale claims are another story. Some of them run ahead of the evidence by orders of magnitude, and one table does not reconcile with its own sunlight numbers.
| The 60-second version
What it is: Sunlight heats water, the hot water is pumped into porous rock 1,500 to 3,000 feet down, and the rock holds the heat until the grid needs power. What is proven: A national lab study published May 4, 2026, in *npj Thermal Science and Engineering* finds four U.S. sites could hold roughly 24 to 900 terawatt-hours of heat (Witter et al.). DOE has funded a 100-kilowatt pilot with “more than 12 hours of storage” (DOE). What is claimed: About 400 megawatts from one field for 40-plus days (Umbro et al., p.4), and 1,608 gigawatts from nine San Joaquin Valley oil fields (p.5). Neither has been built or tested. What it costs: A 2024 national lab model, co-authored by PRM, puts solar-charged GeoTES power at $154 to $187 per megawatt-hour before tax credits, in the range of gas peakers (Zhu et al. 2024; Lazard 2026). Why it matters to you: Data centers want power around the clock. Batteries usually give about four hours. Storage that lasts weeks would be new. This seems like a great cross between Oil and Gas Exploration and true Geothermal energy. |
What GeoTES is, in plain English
Think of a giant underground thermos. In an old oil field, the sandstone is full of tiny connected pores, the way a kitchen sponge is. The industry has spent a century learning how to push fluids through that rock. Umbro’s team wants to put that skill to a new use.
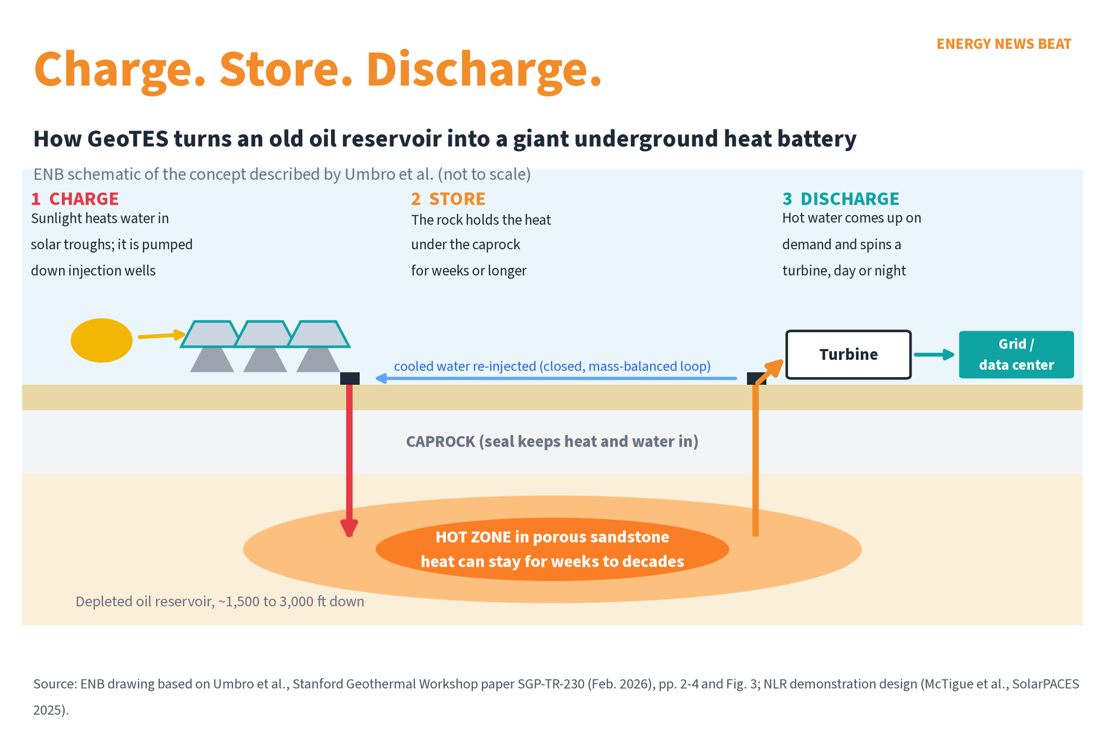
First comes the charge. Rows of curved mirrors called parabolic troughs focus sunlight on pipes and heat water. The hot water goes down injection wells into the reservoir. Next is store. A layer of tight rock above, the caprock, keeps the heat and water in place. The Stanford workshop paper by Umbro and four co-authors says injected heat “persists for decades,” enabling storage “measured in weeks rather than hours” (Umbro et al., pp.2-3). The last step is discharge. When the grid needs power, producing wells bring hot water back up to run a turbine. The cooled water is re-injected, in a closed loop with the amounts going in and out kept in balance (Umbro et al., p.4).
There is a bonus for an oilman. Hot water thins heavy crude, so the same circulation works as a hot waterflood that can lift more oil out of the field (Umbro et al., p.6). The approach is patented as U.S. Patent No. 12,487,011 (Google Patents).
What the documents say
Stu shared four documents with ENB. Each says something different, so it matters which is which.
- The Stanford paper, “A Technical Approach to Prove the Power Generation Potential and Efficiency of Storing Thermal Energy in Porous Permeable Sandstone Reservoirs,” presented at Stanford’s 51st geothermal workshop in February (SGP-TR-230).
- A nine-slide deck that presents the same paper.
- A six-page Executive Briefing dated June 5, 2026, addressed to Secretary Doug Burgum and Secretary Chris Wright. This is the Wright and Burgum presentation. It carries Umbro’s name and the DOE award number DE-EE0011495. The document does not itself record a meeting.
- A five-page paper on “Major Obstacles” to oil, gas and geothermal in California, prepared for DOE and the National Energy Dominance Council, which Burgum chairs.
Here are the headline findings, in the documents’ own words:
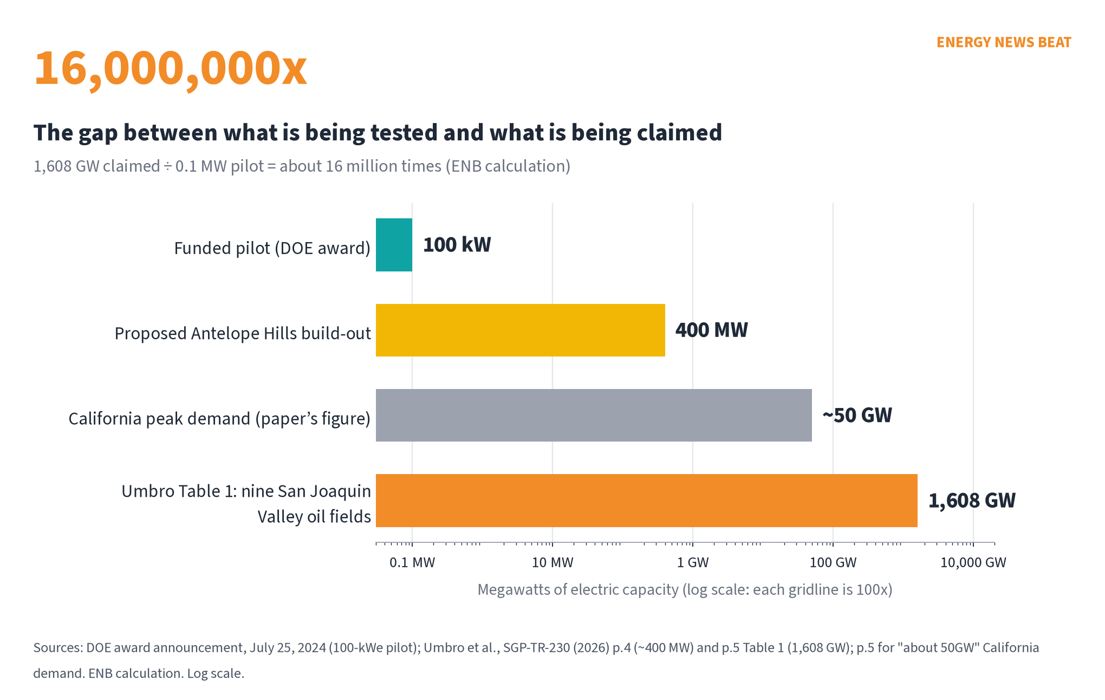
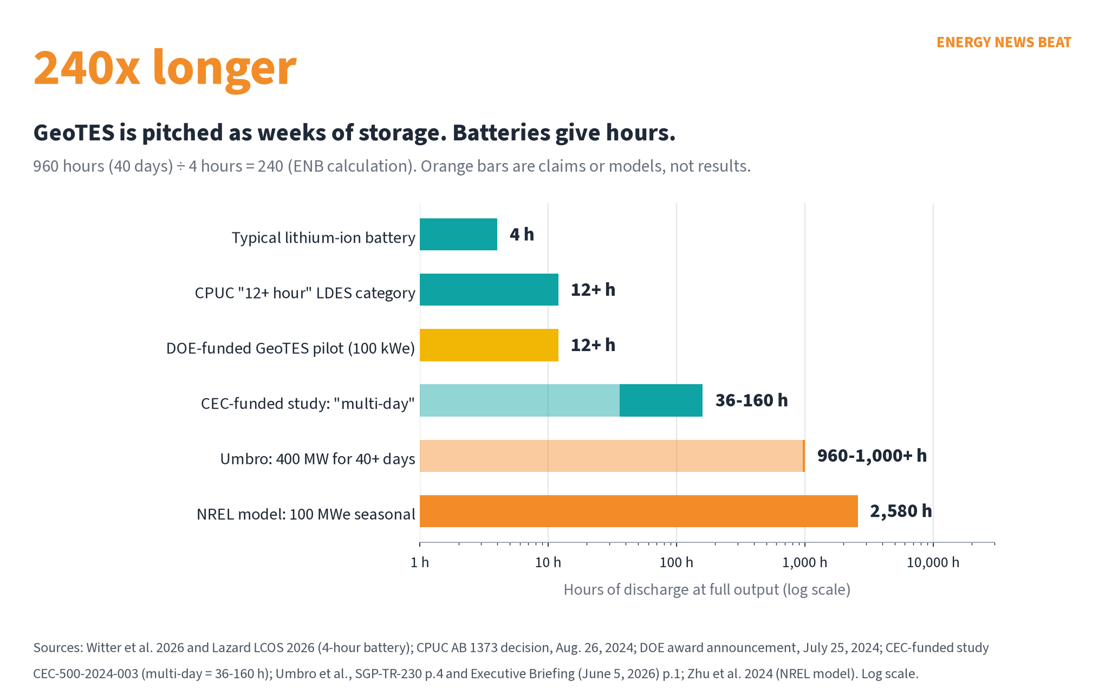
- One field, 400 MW: “the Antelope Hills Field can be used to produce ~400 MW of electric power in perpetuity for five hours each night,” or “400MW of power for over 40 days” (paper, p.4). The briefing rounds this to “~400 MW / 1,000+ Hours” (briefing, p.1). Forty days is 960 hours, so the two documents differ slightly (ENB calculation).
- Nine fields, 1,608 GW: Table 1 lists nine San Joaquin Valley fields with 23,411 TWh of storage and 1,608 GW of five-hour power, “over 30 times” California’s demand of “about 50GW” (paper, p.5-6). The briefing calls 23,411 TWh “108× CA in-state generation” (briefing, p.1).
- Efficiency: The paper’s title promises to prove efficiency, but ENB found no numeric round-trip efficiency in the paper, deck or briefing. The paper describes mass-balanced loops that make heat storage “highly efficient” (paper, p.4).
- Cost: The briefing says storage capital costs “$0.20–$2.50/kWhe (Witter et al., 2026),” against lithium-ion at “$66–$477/kWhe” (briefing, p.2).
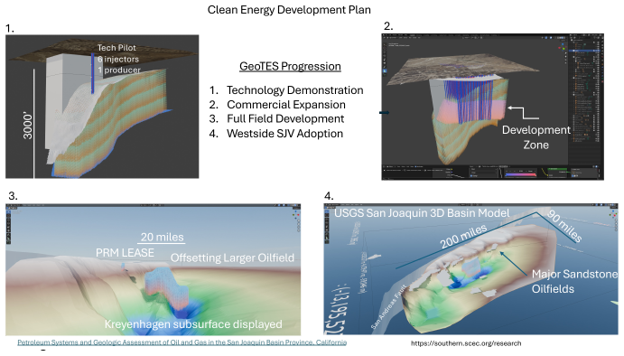
- Pilot plan: a technology pilot of six injectors and one producer, then commercial expansion, full-field development and adoption across the Westside of the valley (deck, slide 7). The briefing says the demonstration with the National Laboratory of the Rockies (NLR, formerly NREL) happens “(2028)” (briefing, p.3; DOE).
What checks out, and what does not
As of 3:00 p.m. CT Sunday. Award data were last modified July 29, 2026, on USAspending.gov.
The science is real. In May, NLR researchers published a study in *npj Thermal Science and Engineering*. They found that four U.S. sites, including Umbro’s Antelope Hills field, could store roughly 24 to 900 terawatt-hours of heat, or about 2 to 100 terawatt-hours of electricity (Witter et al. 2026). For Antelope Hills alone, they estimate 35 to 77 TWh of heat and 4.0 to 8.6 TWh of electricity (Table 1). Umbro’s 400 MW for 40 days works out to 384 gigawatt-hours. That is about 4% to 10% of NLR’s Antelope Hills range, so this claim fits inside the lab’s numbers (ENB calculation).
The money is real, but small. DOE picked PRM in July 2024 for $6 million to build a “100-kilowatt electric demonstration power plant with more than 12 hours of storage” (DOE). Federal records show the award signed Sept. 18, 2025, with $4.8 million in federal money obligated, of which only $114,654.63 had been spent, and $13.7 million in non-federal cost share. The current period of performance ends Dec. 31, 2026 (USAspending). An NLR paper describes the planned demo as a 2-megawatt-thermal trough field, seven wells and a 100-kilowatt power cycle (NLR).
The big numbers are not national lab numbers. The obstacles paper says an “NLR peer-reviewed analysis confirms” a minimum of 23,411 TWh (obstacles, p.2). It does not. That figure comes from Umbro’s own Table 1. For Belridge, the one field in both studies, Umbro lists 2,905 TWh for the whole field. NLR’s estimate for sample volumes in Belridge South is 267 to 458 TWh. NLR says its figures cover “discrete volumes within each reservoir” and “do not represent the entire case study oil fields,” and its Belridge South estimate rests on “only three data points” (Witter et al.). So the two are not directly comparable, but Umbro’s whole-field figure is 6 to 11 times larger (ENB calculation). The 108-times comparison also sets stored heat against electricity, even though NLR says heat-to-power conversion is “generally <20%” (Witter et al.). Even at 20% conversion, the electricity would be at most about 22 times California’s in-state generation (ENB calculation). And the paper itself describes the 23 PWh as “solar radiation” gathered across the nine fields (paper, p.6). That is about 8.2 years of the table’s own daily sunlight (ENB calculation).
The research trail is public. Idaho National Laboratory’s Phase I GeoTES report came out in 2022 (INL). NREL published techno-economic studies in 2023 and 2024 (NREL; OSTI), a 2025 review with LBNL and INL (RSER) and a January 2026 update on seasonal storage and data center cooling (NLR). PNNL’s related work tests heat storage in fractured hard rock rather than oil-field sandstone (PNNL).

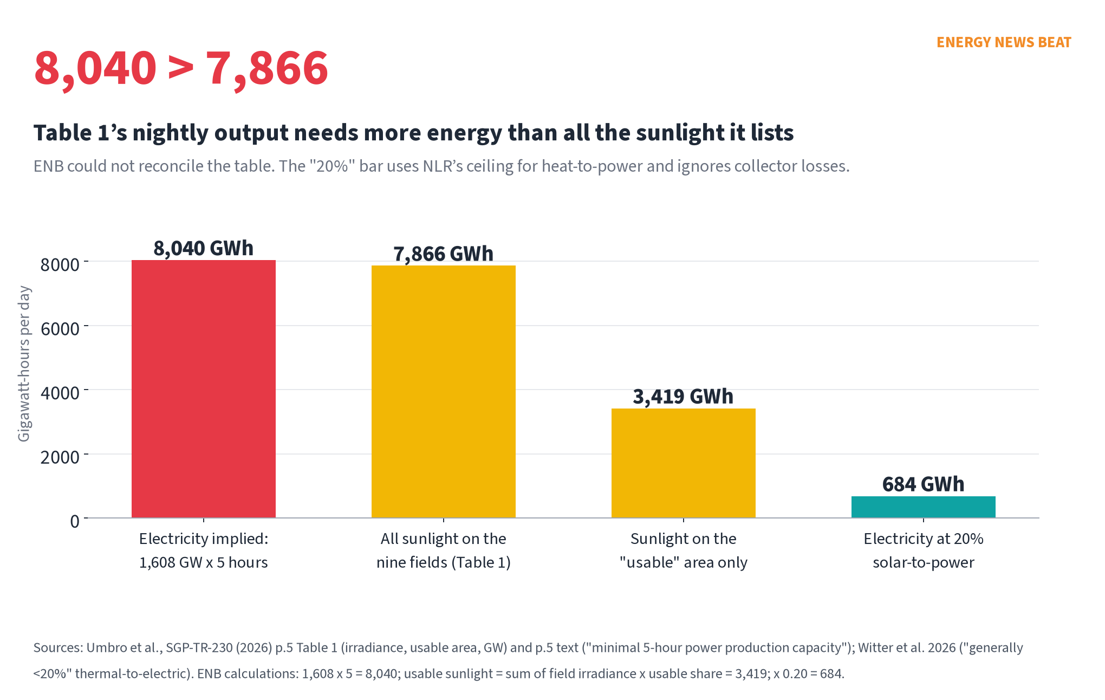
Table 1 does not reconcile with its own sunlight. The table gives each field’s average daily sunlight, the share of land usable for mirrors, and a “minimal 5-hour power production capacity” (paper, p.5). Five hours at 1,608 GW is 8,040 gigawatt-hours a day. That is more than the 7,866 GWh of sunlight the table says falls on all nine fields, before any mirror or turbine losses. On the usable land alone, sunlight is about 3,419 GWh a day. At NLR’s 20% ceiling for heat-to-power, that becomes roughly 684 GWh of electricity (ENB calculations). The table’s sunlight figures also imply about 11 kWh per square meter per day, above the 6 to 7.5-plus that NLR’s technology baseline gives for the sunny Southwest (NLR ATB). Maybe the table measures something other than what it appears to measure. We will ask Umbro.
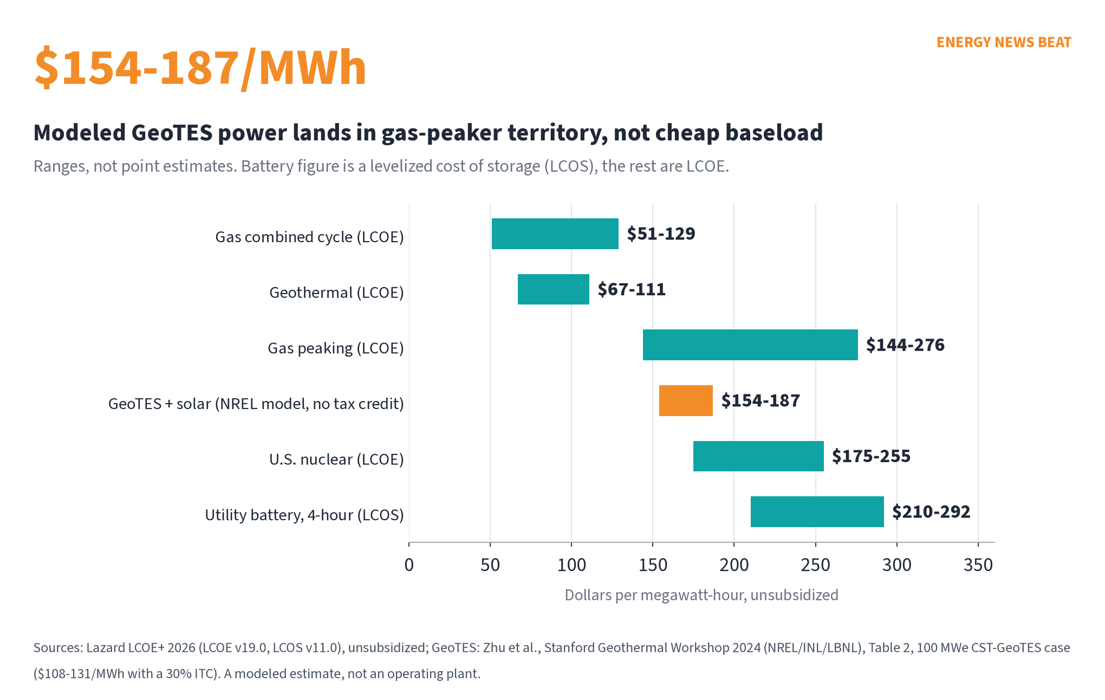
The cost comparison is not apples-to-apples. The briefing’s comparison does come from NLR: the study calls its $0.2 to $2.5 per kWh range “competitive” with utility-scale battery costs of about $66 to $477 per kWh. But that range covers the wells only, and the study itself calls it “a capital cost, not a levelized cost” (Witter et al.). Mirrors, turbines, and operations come on top. In a 2024 Stanford workshop paper led by NREL (now NLR) with INL and LBNL, and co-authored by PRM’s Umbro and Lederhos, researchers modeled a full 100-MW solar GeoTES plant. The cost came out at $8,210 to $8,980 per kilowatt and a levelized $154 to $187 per megawatt-hour, or $108 to $131 with a 30% tax credit. Their verdict: “Compared to alternatives … the GeoTES concepts are more expensive. However … seasonal” (Zhu et al. 2024). PRM’s own endnote prices a 400-MW build-out at $2 billion (obstacles, endnote 8). That is $5,000 per kilowatt (ENB calculation), well below the lab’s model.
Old oil fields, new job
This is where GeoTES gets interesting for anyone who runs an oil field. California has a lot of old wells and a large cleanup bill coming. The California Council on Science and Technology counted 106,687 active and idle wells in 2018 and put the cost to plug and decommission all of them at about $9.1 billion (CCST). By 2023, the state’s idle-well report listed 35,057 idle wells, 16,955 of them idle for eight years or more (CalGEM).
| California wells and liabilities | Figure | Source |
| Active + idle wells in California (2018) | 106,687 | CCST, 2018 |
| Cost to plug and decommission all of them | ~$9.1 billion | CCST, 2018 |
| Marginal or idle wells (2018) | 69,425 | CCST, 2018 |
| Likely or at-risk orphan wells | 5,540 (state liability ~$500 million) | CCST, 2018 |
| Average cost to plug an orphan well | $68,000 | CCST, 2018 |
| Operator bonds on file | ~$110 million | CCST, 2018 |
| Idle wells (2023) | 35,057, incl. 16,955 idle 8+ years | CalGEM, 2023 report |
GeoTES could change that math in four ways. The paper argues that oil-field data is the key, because “the upfront cost to explore for compatible reservoirs would be uneconomically high” (paper, p.4). A century of logs, cores and production records is already on file. Existing wells, roads, pipe and power lines could be reused. A field earning money from power stays in business longer, which pushes plugging costs into the future instead of onto the state. And the hot water flood could recover more oil. The briefing claims “approximately 40 million barrels of recoverable crude” at Antelope Hills (briefing, p.1), a figure ENB could not verify.
One caution. Reuse delays plugging; it does not cancel it. NLR’s study says one terawatt-hour of heat at a 1,000-hour discharge needs 24 to 190 wells, at $750,000 to $1.25 million each (Witter et al.). Many of those may have to be new wells built for hot water, not old ones. Every well, old or new, eventually needs a plug. ENB has covered how few new wells California allows (ENB), and how oil wells could feed the next AI boom (ENB). The paper’s own illustration of the oil-recovery effect is in Appendix F.
Can it keep a data center running?
As of 3:00 p.m. CT Sunday
Data centers want firm power, all day and all night. Demand is climbing fast. LBNL says data center use could reach 325 to 580 terawatt-hours by 2028, from 176 in 2023 (LBNL). EPRI says data centers could use 4.6% to 9.1% of U.S. electricity by 2030 (EPRI). EIA expects the strongest four years of U.S. demand growth since 2000 (EIA). PJM, the largest U.S. grid operator, now sees summer peak demand rising about 66,000 MW to roughly 222,000 MW by 2036 (PJM).
Here is how GeoTES stacks up against what utilities buy today. The costs are Lazard’s 2026 unsubsidized ranges.
| Option | Size and duration | How it is dispatched | Cost ($/MWh) |
| Lithium-ion battery, 4-hour | Hours; durations “do not typically exceed 4 h” (Witter); round-trip efficiency ~85% (NREL) | Instant; recharges from the grid | $210-292 (storage LCOS) (Lazard) |
| Gas peaker | As long as fuel flows; new turbines “fully booked out to 2030” (Witter) | Minutes | $144-276 (Lazard) |
| Conventional geothermal | Runs 24/7; California has 68.6% of U.S. geothermal output (EIA) | Baseload, steady | $67-111 (Lazard) |
| GeoTES (PRM claim) | ~400 MW: 2,000 MWh a night (5 h) or 384,000 MWh over 40 days (ENB calc. from paper, p.4) | Discharge on demand; recharge with sunlight | No PRM figure. NLR model: $154-187 (Zhu 2024) |
| GeoTES (tested so far) | 100 kWe pilot, 12+ hours planned (DOE) | Not yet operating, per public records reviewed by ENB; $114,654.63 of $4.8M federal funds spent (USAspending) | n/a |
On duration, GeoTES has no real rival. A four-hour battery cannot ride through a week of winter clouds. A CEC-funded study uses 36 to 160 hours as “multi-day” storage (CEC). The state’s central buyer is authorized to procure up to 1 gigawatt of multi-day storage, 1 gigawatt of 12-hour-plus storage and 1 gigawatt of geothermal (CPUC). That is a market GeoTES could bid into. The briefing goes further and says “CAISO requires 90 GW of 10+ hour storage by 2045” (briefing, p.2). ENB could not find that requirement, and CAISO plans the grid rather than setting procurement mandates. CAISO’s own 2024 20-Year Transmission Outlook assumes about 4 GW of long-duration storage plus 5 GW of generic clean-firm or long-duration resources by 2045, alongside 48.8 GW of batteries (CAISO). The CEC-funded study modeled up to 5 GW of long-duration storage as cost-effective by 2045 if gas stays in the mix, and up to 37 GW in a zero-carbon case. Those are modeled builds, not requirements (CEC).
On cost, the honest answer is “not yet known.” The lab-modeled cost lands inside the gas-peaker range and above conventional geothermal. The value case rests on duration and on cheap summer sunlight that would otherwise go to waste. CAISO curtailed 3.4 million megawatt-hours of solar and wind in 2024, up 29%, and 93% of it was solar (EIA). Soaking up that surplus is exactly what GeoTES is pitched to do.
The permit wall, and what Washington can do
As of 3:00 p.m. CT Sunday. Permit counts and agency actions change weekly.
Umbro’s documents spend as much time on Sacramento as on geology. The Stanford paper says the project’s permitting has been “under review by multiple California state agencies since 2018” (paper, p.3). The deck goes further and accuses agencies of “illegal permit denials” (deck, slide 9). Those are the authors’ claims, and ENB has not tested them. Here is what we could check:
- The State Water Board gave preliminary concurrence on April 8, 2026, to an aquifer exemption for the Tulare Oil Sand at North Antelope Hills, which would allow Class II injection (Water Board). The briefing said public comment was set for July 16 (briefing, p.2). CalGEM says a public hearing was held that day and the comment period closed July 31, and it lists North Antelope Hills as “Public Hearing Complete” (CalGEM). Final approval still rests with CalGEM and the U.S. EPA, and the briefing says GeoTES also needs an underground injection project approval letter (briefing, p.2).
- SB 1137 does create a 3,200-foot health protection zone around homes, schools and other sensitive sites (CalGEM).
- The briefing says AB 1167 “requires $25,000 bonding per acquired well” (briefing, p.3). The law actually requires a buyer of idle or marginal wells to post a bond covering CalGEM’s full estimated plugging cost, unless an exemption applies (AB 1167; CalGEM notice). It is not a flat $25,000.
- The briefing counts “fewer than 335 new drill permits” in 2026 (briefing, p.3). Consumer Watchdog counted 320 through May 9 (Consumer Watchdog), and a FracTracker count reported by KERO found 353 in the first half, against 17 in all of 2025 (KERO). Those totals line up. But the jump came after SB 237 let Kern County run environmental review again (CalGEM), so “shut down” now overstates it. The split by operator size and the 24-day vs. 513-day approval times could not be verified.
The briefing makes three asks of Washington: keep funding the project’s third budget period, have Interior and the National Energy Dominance Council document California’s obstacles on the record, and designate the Westside of Kern County a “Natural Resources Development Zone” (NRDZ) (briefing, pp.4, 6). It also proposes a federal captive bonding facility for small operators, plus approving the aquifer exemption and injection permit together (briefing, p.4-5).
The federal levers are real but limited. DOE controls the award money and its timeline. Interior already uses emergency permitting procedures for geothermal on federal land (Interior), but the Antelope Hills injection permits run through California agencies, with EPA review. EPA Region 9 signs off on aquifer exemptions. Under the One Big Beautiful Bill Act, the federal storage tax credit runs through 2033 (Lazard). ENB found no IRS guidance on whether a GeoTES plant would qualify.
Could it work in the Permian, Bakken, Gulf Coast, Appalachia or Alaska?
The rock has to be just right. NLR’s screen looks for reservoirs above 50°C, more than 45 meters thick and at least 10% porosity (Witter et al.). Umbro’s list adds closed boundaries, high permeability, full liquid saturation, compatible brackish water and room on the surface for a big solar field (paper, p.4). Permeability is the key word. It measures how easily fluid moves through rock, in millidarcies (mD). Shale oil plays are tight by design, which is why they need fracking.
| Region | Reservoir example | What the rock looks like | ENB read |
| San Joaquin Valley (benchmark) | Point of Rocks / Tulare, Antelope Hills | At least 1,500 ft deep; natural ~100°F (paper); NLR: 4.0-8.6 TWh_e (Witter) | Best case: good rock, strong sun, oil-field data on file |
| Gulf Coast | Yegua-Jackson; Carrizo-Wilcox (Texas) | 2,000-3,000 ft, ~50-60°C, >30% porosity, >1,000 mD (Zhu 2024); Carrizo-Wilcox 34-101 TWh_e (Witter) | Strong geology; less sun, so heat pumps or other heat sources likely |
| Permian | Wolfcamp, Bone Spring | Wolfcamp porosity “between 2.0% and 12.0%,” needs “multistage hydraulic fracturing” (EIA, p.15); Bone Spring sands 8-20% porosity, “less than a few millidarcies” (EIA, p.22); Southwest sun 6-7.5+ kWh/m²/day (NLR) | Great sun, wrong rock in the shale; conventional zones would need screening |
| Bakken | Middle Bakken | Average permeability 0.04 mD (USGS) | Poor fit: tight rock, weak winter sun |
| Appalachia | Marcellus/Utica and old shallow fields | ENB found no GeoTES screening study for the basin | Unknown; old wells plentiful, sunlight limited |
| Alaska North Slope | Ivishak, Prudhoe Bay | 8,200-9,200 ft subsea; permeability “from a few millidarcys to tens of darcys” (AAPG) | Good rock but deep and cold; little winter sun; heat would need another source |
Outside the sunny Southwest, a GeoTES plant would likely be charged by grid electricity through heat pumps, a “Carnot battery.” That changes the math. National lab modeling puts the real round-trip efficiency of that version at 30% to 34% (Zhu et al. 2024), against about 85% for a lithium-ion battery (NREL). Water matters everywhere. The process needs compatible brackish water (paper, p.4). That suits produced-water-rich oil fields, but it means every project needs a water plan.
Stu’s Take: energy security starts at home
As of 3:00 p.m. CT Sunday. Figures are from fiscal 2025 annual reports.
| Stu’s Take
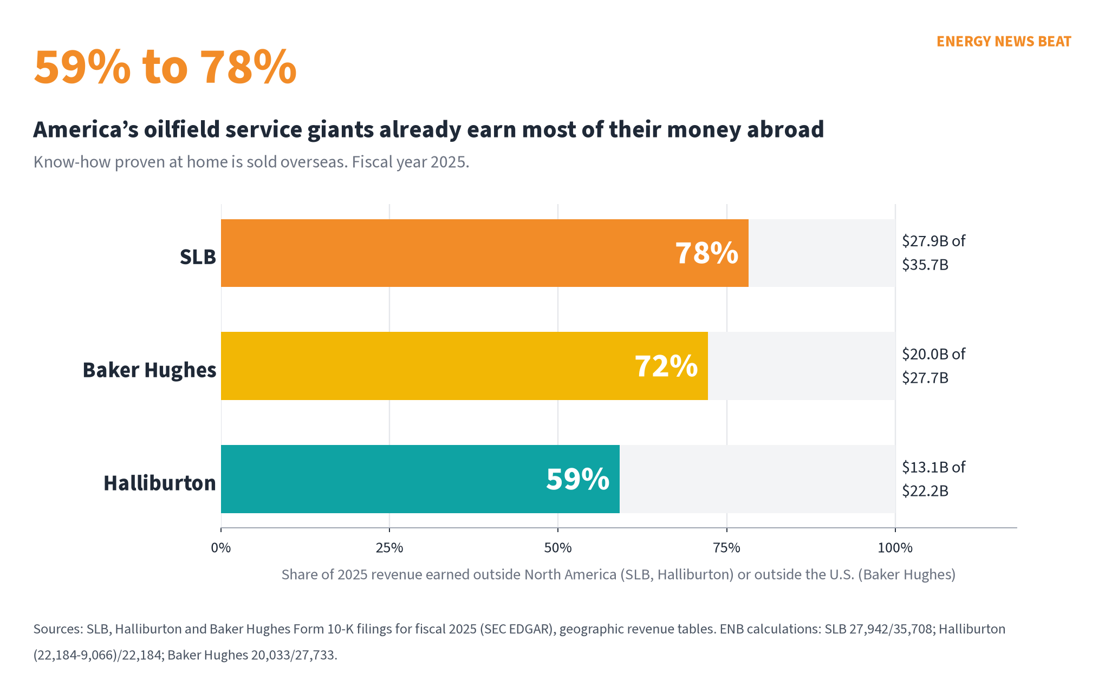
Energy security starts at home, and your energy dominance is displayed through your exports. That is my thesis, and GeoTES is a good test of it. Look at who America’s oilfield service giants really work for. SLB booked $27.9 billion of its $35.7 billion in 2025 revenue outside North America, about 78% (SLB 10-K). Baker Hughes earned $20.0 billion of $27.7 billion outside the U.S., about 72% (Baker Hughes 10-K). Halliburton earned $13.1 billion of $22.2 billion outside North America, about 59% (Halliburton 10-K). Those percentages are our math from their own tables. That is the model. Prove it at home, then sell it to the world. Oman has already put solar steam to work in heavy oil: the Miraah project at the Amal field was designed for 1,021 megawatts thermal, and its first units opened in 2018 (SolarPACES). Every major oil province has old reservoirs and sunshine. If Kern County proves sandstone can store heat for weeks, American engineers, drillers and service firms can export that know-how the way they export fracking. But you only get to export what you prove. California has 68.6% of U.S. geothermal generation (EIA), and the GeoTES paper says the permit has been under state review since 2018 (paper, p.3). Wright and Burgum should get the 100-kilowatt pilot (DOE) built and measured, fast. If it works, scale it. If it does not, we learn that cheaply. Either way, the data should be public. We believe in Mike Umbro, Secretary Chris Wright, and Secretary Doug Burgum. They can get this done, and if the geology supports it, we should rebrand it as “Truly Renewable Energy through Oil and Gas Exploration Techniques”. |
How consumers and investors see it
As of 3:00 p.m. CT Sunday
Consumers. ENB found no polling on GeoTES itself. People are clearly worried about what data centers will do to their bills, though. In the Morning Consult survey for ARI, taken July 17 to 19, 77% of registered voters were concerned about higher bills, and 78% backed making data centers pay for grid upgrades (ARI). The AP-NORC and University of Chicago EPIC poll found 63% concerned about higher electricity prices, including 58% of Republicans (EPIC). Any storage technology that keeps data center costs off household bills will have a friendly audience.
Investors. PRM is private, and ENB found no public investor commentary on GeoTES. The nearest signals come from next-generation geothermal. Fervo Energy priced an upsized IPO of 70 million shares at $27 on May 12, about $1.89 billion before fees (ENB calculation; Fervo; ENB on Fervo). Meta signed with Sage Geosystems for up to 150 MW of geothermal for its data centers (Meta). Storage is still getting more expensive: Lazard’s 2026 report shows battery storage costs up from last year (Lazard 2026; Lazard 2025). Money is moving toward firm, clean power. GeoTES has not yet shown the operating data investors look for.
The risks
- Heat loss. NLR says heat recovery above 90% depends on pre-charging the reservoir, and heat-to-power conversion is generally under 20% (Witter et al.). Much of the sunlight never becomes electricity.
- Reservoir integrity. Hot water changes rock and brine chemistry. National lab authors flag mineral scaling and corrosion as key risks (Zhu et al. 2024).
- USGS says most induced quakes come from wastewater disposal, and that injection volume, pressure and nearby faults drive the risk (USGS). GeoTES balances what it injects with what it produces, which should help, but it still needs monitoring.
- The project needs an aquifer exemption and compatible brackish water (Water Board; paper, p.4). Expect public scrutiny.
- The lab-modeled cost lands in peaker territory, and the wells-only cost figure leaves out mirrors and turbines (Zhu et al. 2024; Witter et al.).
- Scale-up. Going from 100 kW to 400 MW is a 4,000-fold leap (ENB calculation). Solar-thermal oil projects have stumbled before: GlassPoint, the developer of Oman’s Miraah plant, entered liquidation in 2020, though Petroleum Development Oman said work would continue (Middle East Construction News).
The bottom line
Is GeoTES the holy grail for data centers? Not on today’s evidence. The holy grail would be cheap, firm and proven. GeoTES is promising, potentially firm for weeks at a time, and unproven at any meaningful scale. What it does have is a real federal award, a published national lab study behind the core idea, a water permit moving forward, and a founder who knows his reservoir. The fastest way to settle the debate is to build the 100-kilowatt pilot, measure what comes out and publish the numbers. For families paying 33 cents a kilowatt-hour, that test is worth running. For more on the geothermal push, see ENB’s report on the 150-gigawatt geothermal opportunity.
| Questions for Mike Umbro
1. Table 1: At 1,608 GW for five hours, the nine fields would deliver 8,040 GWh a night, more than the 7,866 GWh of daily sunlight the same table lists. What exactly does the GW column measure? 2. The NLR study: Your obstacles paper says NLR “confirms” 23,411 TWh. NLR’s four-site range is 24 to 900 TWh of heat, and its Belridge South sample-volume estimate is 267 to 458 TWh against your whole-field 2,905. Your paper also calls the 23 PWh “solar radiation.” Is 23,411 TWh stored heat, or cumulative sunlight? 3. Efficiency: The paper’s title promises to prove efficiency, but gives no number. What share of the sunlight, and of the stored heat, do you expect to come back as electricity? 4. Status: The briefing calls the project “actively operating.” What is physically running today? Will the 100-kW NLR demo start in 2026 or 2028, given that the federal award period ends Dec. 31, 2026? 5. Cost: What is your all-in cost per kilowatt and per megawatt-hour? Your $2 billion for 400 MW is $5,000/kW. The lab modeled $8,210 to $8,980/kW. 6. Formation: Will you inject into the Point of Rocks, as the paper says, or the Tulare Oil Sand named in the aquifer exemption? What is left before the injection approval letter? 7. Water and wells: How much brackish water will you need, from where, and how will you handle scaling, corrosion and seismic monitoring at these temperatures? 8. Customers: Has any data center, utility or the state’s central LDES buyer talked with you about buying GeoTES power? 9. Beyond California: Which basin is next, Gulf Coast, Permian or elsewhere? Without strong sun, would you charge with heat pumps, at 30% to 34% round-trip efficiency? 10. Oil: Whose estimate is the 40 million barrels, and is it a booked reserve or a resource estimate? |
Check out the World’s Greatest Podcast Show Notes at EnergyNewsBeat.co or EnergyNewsBeat.com. And subscribe to: The Energy News Beat Substack.
Appendices
At Energy News Beat we Make Appendices Great Again. Times are U.S. Central (CDT, UTC−5). Fast-moving items (prices, permits, project status) are current as of 3:00 p.m. CT, Sun., Oct. 11, 2026. Labels: [DOC] = a claim made in one of the four PRM documents; [VERIFIED] = matched to an independent source; [ENB CALC] = arithmetic by ENB from cited figures; [ENB JUDGMENT] = Energy News Beat assessment; [OPINION] = Stu’s view. Page numbers refer to the PDF page of each document.
Download the data. Every number behind the charts and tables is in the companion spreadsheet, “Is Geologic Thermal Energy Storage (GeoTES) the Holy Grail of Energy for Data Centers – Data.xlsx,” available with this article.
Appendix A. Sources (titled and dated)
Note: the deck, Executive Briefing and obstacles paper were provided to ENB by Stu Turley, who has permission to use them. They are not posted publicly as far as ENB could find, so their links point to the company website. The Stanford paper is publicly hosted by Stanford; the public PDF and the copy ENB received have the same title and header.
Appendix B. Key figures
| Item | Figure | Source |
| Which document went to Wright and Burgum | Executive Briefing, “GeoTES & California Energy Production,” June 5, 2026, addressed to Secretary Doug Burgum & Secretary Chris Wright (6 pp.) | Briefing, p.1 |
| Funded pilot | 100 kWe, “more than 12 hours of storage”; $6M selection (July 25, 2024) | DOE |
| Award DE-EE0011495 | Signed Sept. 18, 2025; federal obligation $4.8M; outlays $114,654.63; non-federal $13,663,013; total $18,463,013; performance Oct. 1, 2025 to Dec. 31, 2026 | USAspending |
| Demo design (NLR) | 2 MWth parabolic trough, seven wells, 100 kWe power cycle | NLR |
| NEPA | Categorical exclusion CX-032265; three budget periods; BP1 design only | DOE CX |
| PRM claim, one field | ~400 MW for 5 h nightly “in perpetuity,” or 400 MW for 40+ days (= 2,000 MWh/night; 384,000 MWh over 40 days [ENB CALC]) | Paper, p.4 |
| PRM claim, nine fields | 23,411 TWh storage; 1,608 GW (column sums to 1,607 [ENB CALC]); 7,866 GWh/day irradiance (column sums to 7,867) | Paper, p.5 |
| PRM abstract | “more than 100 gigawatts of clean, firm capacity” across the Western San Joaquin Valley | Paper, p.1 |
| NLR storage estimate | Four sites 24-900 TWh_th (~2-100 TWh_e); Antelope Hills 35.1-76.6 TWh_th (4.0-8.6 TWh_e); Belridge South 266.5-457.9 TWh_th (29.8-51.3 TWh_e) | Witter et al.; Table 1 |
| NLR efficiency notes | Thermal-to-electric “generally <20%”; >90% thermal recovery with pre-charging | Witter et al. |
| NLR well cost | $0.018-0.239/kWh_th (≈$0.2-2.5/kWh_e), “a capital cost, not a levelized cost”; wells $750k-1.25M each; 24-190 wells per TWh_th at 1,000 h | Witter et al. |
| NREL/INL/LBNL modeled plant | 100 MWe CST-GeoTES: $8,210-8,980/kWe; LCOE $154-187/MWh ($108-131 with 30% ITC); 2,580 h at full output | Zhu et al. 2024 |
| Heat-pump GeoTES | Real round-trip efficiency 30.4-33.7% | Zhu et al. 2024 |
| Battery benchmarks | 4-h battery $334/kWh (2024$); round-trip 85% | NREL 2025 |
| Lazard 2026 (unsubsidized $/MWh) | Gas CC 51-129; geothermal 67-111; gas peaking 144-276; nuclear 175-255; 4-h utility storage LCOS 210-292 (148-209 with ITC) | Lazard 2026 |
| California prices, July 2026 | Residential 33.61¢/kWh vs U.S. 18.31¢ (+84% [ENB CALC]); all sectors 30.71¢ vs 14.99¢ | EIA EPM |
| California generation 2024 | In-state 216,181 GWh; total system 278,338 GWh | CEC |
| Curtailment 2024 | 3.4 million MWh, +29%, 93% solar | EIA |
| Data center load | 176 TWh (4.4%) in 2023; 325-580 TWh (6.7-12.0%) in 2028 | LBNL |
| Other forecasts | EPRI 4.6-9.1% by 2030; PJM summer peak ~222 GW by 2036 (+~66 GW); EIA strongest four-year growth since 2000 | EPRI; PJM; EIA |
| California LDES | CAISO 2045 outlook: ~4 GW LDES + 5 GW clean-firm or LDES, alongside 48.8 GW batteries; CEC-funded study: 5 GW (with gas) to 37 GW (zero-carbon) modeled cost-effective by 2045; CPUC AB 1373: up to 1 GW multi-day LDES, 1 GW 12h+ LDES, 1 GW geothermal | CAISO; CEC; CPUC |
| Wells and liabilities | 106,687 active+idle wells; ~$9.1B to plug all; 5,540 likely/at-risk orphans (~$500M); avg orphan plug $68,000 (2018) | CCST |
| Idle wells 2023 | 35,057 idle; 16,955 idle 8+ years | CalGEM |
| New drill permits 2026 | 320 through May 9 (Consumer Watchdog); 353 in first half vs 17 in 2025 (FracTracker via KERO) | Consumer Watchdog; KERO |
| Oilfield services, FY2025 | SLB 78.3% outside N. America; Baker Hughes 72.2% outside U.S.; Halliburton 59.1% outside N. America [ENB CALC] | SLB; BKR; HAL |
| Polls | ARI/Morning Consult (July 17-19, 2026): 77% concerned about bills; 78% data centers pay for grid upgrades. AP-NORC/EPIC 2026: 63% concerned about prices | ARI; EPIC |
Appendix C. Document claims vs. what ENB could verify
Status key: ✔ verified; ~ partly verified or consistent; ✖ contradicted by the cited source; ? could not verify.
| Claim | Document, page | What ENB found | Status |
| Executive Briefing was for Wright and Burgum | Briefing p.1 | Title page addresses both secretaries; ENB did not independently confirm a meeting | ~ |
| Project “federally funded” | Briefing p.1 | DOE award DE-EE0011495 (USAspending) | ✔ |
| Project “actively operating” | Briefing p.1 | No public record of operating wells, troughs or power; award BP1 is design only (DOE CX); demo dated “(2028)” in the same briefing (p.3) | ? |
| “peer-reviewed in npj … (Witter et al., 2026)” | Briefing p.1 | Witter et al. is published in npj Thermal Science and Engineering (article type: Perspective) and includes Antelope Hills (npj); Umbro is not an author; it addresses the concept, not PRM’s Table 1 | ~ |
| NLR “confirms” minimum 23,411 TWh, “80×” CA consumption | Obstacles p.2 | 23,411 is Umbro’s Table 1; NLR four-site total is 24-900 TWh_th (Witter) | ✖ |
| 23,411 TWh = “108× CA in-state generation (216,181 GWh)” | Briefing p.1 | Arithmetic and CEC figure correct (CEC); compares heat with electricity: at <20% conversion, at most ~22x [ENB CALC]; paper p.6 calls the 23 PWh “solar radiation,” ~8.2 years of Table 1’s daily sunlight [ENB CALC] | ~ |
| 1,608 GW (1,607 GW) from nine fields; “over 30 times” CA demand | Paper p.5-6; Briefing p.1 | 5 h x 1,608 GW = 8,040 GWh/day exceeds the table’s 7,866 GWh/day of sunlight [ENB CALC]; abstract says “more than 100 gigawatts” | ✖ (internal) |
| Table 1 irradiance | Paper p.5 | Implies ~11.0 kWh/m²/day on every field; NLR ATB gives 6.0 to 7.5+ for the Southwest (ATB) [ENB CALC] | ? (looks high) |
| ~400 MW, 5 h nightly or 40+ days | Paper p.4 | 384 GWh_e over 40 days = 4-10% of NLR’s 4.0-8.6 TWh_e Antelope Hills range [ENB CALC]; not demonstrated | ~ (plausible scale, unproven) |
| “1,000+ hours” | Briefing p.1 | Paper says 40+ days (960 h); company site says “1,000 hours – 41 days” (site) | ~ |
| Heat “persists for decades”; storage in weeks | Paper pp.2-3 | Consistent with NLR seasonal-storage modeling (Zhu 2024); not yet field-proven at PRM | ~ |
| Storage capital cost $0.20-2.50/kWhe | Briefing p.2 | Matches Witter, which calls the range “competitive” with battery capital costs, but it covers wells only, “a capital cost, not a levelized cost” (Witter) | ~ (context missing) |
| Li-ion $66-477/kWhe (NREL ATB 2024; BNEF 2024) | Briefing p.2 | Range appears in Witter; low end traces to a blog post; NREL 2025 4-h system $334/kWh (NREL) | ~ |
| $2B for 400 MW build-out | Obstacles endnote 8 | = $5,000/kW [ENB CALC]; NREL-led model $8,210-8,980/kWe (Zhu 2024) | ? (below lab model) |
| ~40 million barrels recoverable | Briefing p.1 | No public reserve report found | ? |
| Patent “U.S. 12,487,011” | Briefing p.1; Paper | Granted Dec. 2, 2025, “Renewable GeoBattery energy storage,” inventors Eric L. Berger, Paul E. Harness and Frank Lawrence (Google Patents); company site also cites 12,085,313 | ✔ |
| Permitting under review “since 2018” | Paper p.3 | Not verifiable from public dockets ENB found | ? |
| $6 million SETO grant | Paper p.3 | DOE July 2024 announcement (DOE); federal obligation to date $4.8M (USAspending) | ✔ |
| Awarded under Biden; “one of few awards approved by the Trump Administration” | Paper p.1; Briefing p.3 | Selected July 2024; agreement signed Sept. 18, 2025 (USAspending); “one of few” not verified | ~ |
| Demo with NLR “(2028)” | Briefing p.3 | Award period ends Dec. 31, 2026 (USAspending); extension possible but not public | ? |
| Aquifer exemption preliminary concurrence, April 2026 | Briefing p.2 | April 8, 2026 letter, Tulare Oil Sand, North Antelope Hills (Water Board) | ✔ |
| Public comment set for July 16, 2026 | Briefing p.2 | CalGEM: “A public hearing of the proposal was held on July 16, 2026, and the public comment period ended July 31, 2026”; listed as Public Hearing Complete (CalGEM) | ✔ |
| CAISO curtailed 3.4M MWh in 2024, +29% | Briefing p.2 | (EIA) | ✔ |
| CA “zero planned 500MW+ AI data centers”; ranks 21st of 31 (USC Marshall); VA 20.4 GW vs CA 2.2 GW | Briefing p.2 | USC Marshall source not located | ? |
| “CAISO requires 90 GW of 10+ hour storage by 2045” | Briefing p.2 | Not found; CAISO’s 2024 20-Year Transmission Outlook assumes ~4 GW LDES + 5 GW clean-firm or LDES by 2045 (with 48.8 GW batteries) (CAISO); CEC-funded study models 5-37 GW cost-effective, not required (CEC) | ✖ (contradicted by CAISO outlook) |
| California ~70% of U.S. geothermal | Briefing p.2; Obstacles p.1 | 68.6% of generation in 2025 (EIA) | ✔ |
| 20× CA installed generation (~80 GW) | Briefing p.2 | Arithmetic holds for 1,607/80; ~80 GW installed not checked; inherits Table 1 problem | ? |
| Fewer than 335 new drill permits in 2026; 313/18/4 split; 24 vs 513 days | Briefing p.3 | Totals consistent with 320 (May 9) and 353 (H1) (CW; KERO); split and timing not verified | ~ / ? |
| SB 1137 3,200-ft setbacks | Briefing p.3 | (CalGEM) | ✔ |
| AB 1167 “$25,000 bonding per acquired well” | Briefing p.3 | Law requires a bond for CalGEM’s full P&A estimate for idle/marginal wells (AB 1167; NTO) | ✖ |
| ~30% of oil resources shut in | Briefing p.3 | No source found | ? |
| Colorado residential power +40%; crude 192M→170M bbl | Obstacles p.2; Briefing | Not checked against EIA in this report | ? |
| Legislators’ Sept. 26, 2025 NRDZ (Natural Resources Development Zone) letter | Obstacles endnotes | Not located | ? |
| Exhibit D: CA all-sector rate 108% above U.S. (2024) | Obstacles p.4 | Consistent with EIA (July 2026: 30.71¢ vs 14.99¢) (EIA) | ~ |
| Deck slide 9: “illegal permit denials,” agencies fear “retribution by the Governor and NGO lawfare” | Deck p.9 | Opinion; no evidence provided in the documents | ? (opinion) |
Appendix D. Glossary
| Term | Meaning |
| GeoTES | Geologic thermal energy storage: storing heat in underground rock and water for later use. |
| CST | Concentrating solar thermal: mirrors that focus sunlight to make heat, not electricity directly. |
| Parabolic trough | A long curved mirror that focuses sunlight onto a pipe carrying fluid. |
| RTES / ATES | Reservoir or aquifer thermal energy storage: GeoTES in a reservoir or aquifer. |
| Carnot battery (CB-GeoTES) | Storing electricity as heat using heat pumps, then turning it back into power. |
| Porosity | The share of rock volume that is open pore space. |
| Permeability | How easily fluid flows through rock, measured in millidarcies (mD) or darcies. |
| Caprock | A tight rock layer above a reservoir that seals in fluids and heat. |
| Hot waterflood | Injecting hot water to push and thin oil toward producing wells. |
| P&A | Plugging and abandonment: permanently sealing a well at the end of its life. |
| Idle / orphan well | Idle: not producing for a set period. Orphan: no solvent operator left to plug it. |
| Aquifer exemption | A federal-state decision that an aquifer will not be used for drinking water, allowing injection. |
| UIC / Class II | Underground Injection Control; Class II wells are oil and gas related injection wells. |
| MW / MWh | Megawatt (power, a rate) and megawatt-hour (energy, an amount). 1 GW = 1,000 MW; 1 TWh = 1,000 GWh. |
| _th / _e | Thermal (heat) vs electric. Heat is worth less than electricity: NLR says under 20% converts. |
| LCOE / LCOS | Levelized cost of energy or of storage: lifetime cost per MWh delivered. |
| LDES | Long-duration energy storage; usually 10 hours or more. |
| Round-trip efficiency | Share of energy put into storage that comes back out as electricity. |
| ITC | Investment tax credit. |
| NLR | National Laboratory of the Rockies, renamed from NREL on Dec. 1, 2025. |
| NEDC | National Energy Dominance Council. |
| NRDZ | “Natural Resources Development Zone,” a designation for the Westside of Kern County proposed in PRM’s briefing and obstacles paper. |
Appendix E. Methodology
Documents. ENB read all four PRM documents in full and extracted text and figures page by page. The Executive Briefing is identified as the Wright and Burgum presentation because its title page reads “Briefing for Secretary Doug Burgum & Secretary Chris Wright,” it is dated June 5, 2026, and it is signed by Mike Umbro with the DOE award number. The obstacles paper is a companion prepared “for U.S. DOE & National Energy Dominance Council.” The deck is a slide version of the Stanford paper.
Separating claims from facts. Every number attributed to the documents is labeled with document and page. Numbers stated as fact are matched to an independent source linked in the text. Where the two disagree, both are shown (Appendix C).
Calculations. 400 MW x 5 h = 2,000 MWh; 400 MW x 960 h = 384,000 MWh. 384 GWh ÷ 8.6 TWh = 4.5% and ÷ 4.0 TWh = 9.6%. 1,608 GW x 5 h = 8,040 GWh. Usable sunlight = Σ(field irradiance x usable share) = 3,419 GWh/day; x 0.20 = 684 GWh/day. 23,411 TWh x 0.20 ÷ 216.181 TWh = 21.7. 7,866 GWh/day x 365 = 2,871 TWh/yr; 23,411 ÷ 2,871 = 8.2 years. Implied irradiance = 7,866 GWh ÷ (276 sq mi x 2.590 km²/sq mi = 714.8 km²) = 11.0 kWh/m²/day. 2,905 ÷ 457.9 = 6.3; 2,905 ÷ 266.5 = 10.9. $2B ÷ 400 MW = $5,000/kW. 1,608 GW ÷ 0.1 MW = 16.08 million; 400 MW ÷ 0.1 MW = 4,000. 33.61 ÷ 18.31 − 1 = 83.6%. 580 ÷ 176 = 3.3. 70M x $27 = $1.89B. 960 ÷ 4 = 240. Oilfield service shares: SLB 27,942 ÷ 35,708; Halliburton (22,184 − 9,066) ÷ 22,184; Baker Hughes 20,033 ÷ 27,733.
Comparisons. Lazard LCOE (generation) and LCOS (storage) ranges are unsubsidized and are not perfectly comparable, as labeled. The GeoTES cost is a modeled national lab estimate (2024), not a quote from PRM or an operating plant.
Figures. Charts 1-8 are ENB originals. Document figures are reproduced from the PRM documents with permission and credited to Umbro et al. or the specific document, with page numbers. Page numbers are PDF pages.
Geology table. Basin descriptions summarize public USGS, EIA, AAPG and national lab sources; the “ENB read” column is ENB judgment, not a site screening.
Limits. ENB did not interview PRM, the labs or state agencies for this piece. The Stanford paper text differs slightly in file build from the public copy, with the same title and header.
Appendix F. Extracted document figures
Additional figures from the PRM documents, reproduced with permission. Credit: Umbro et al. and Premier Resource Management.
Figure F0. “Heating Increases Oil Flow”: Umbro’s illustration of how hot water raises oil recovery (Buckley-Leverett method). Source: Umbro et al., SGP-TR-230 (2026), Figure 5, page 6.
Figure F1. “Reservoir Heating, 1/2 Acre Seven Spot”: modeled reservoir temperature over time. Source: Umbro et al., SGP-TR-230 (2026), Figure 2, page 3.
Figure F2. Patent process flow showing the three closed loops (solar, reservoir, power). Source: Umbro et al., SGP-TR-230 (2026), Figure 3, page 4.
Figure F3. “Energy Production by Reservoir Type.” Source: Umbro et al., Stanford_2026_PRM presentation, slide 3 (page 3).
Figure F4. “Heat Accumulation in the Reservoir”: the synthetic geothermal process, three closed loops, concentrated solar thermal and thermal energy storage. Source: Umbro et al., Stanford_2026_PRM presentation, slide 4 (page 4).
Figure F5. 3D pilot block: about 2 miles, 50 patterns, 200 acres, ~3,000 ft. Source: Umbro et al., Stanford_2026_PRM presentation, slide 6 (page 6).
Figure F6. Table 1 slide: estimated capacity of nine oil fields. Source: Umbro et al., Stanford_2026_PRM presentation, slide 8 (page 8).
Figure F7. Exhibit D, California electricity rates vs. U.S. Source: “Major Obstacles to Unleashing Oil, Gas & Geothermal Production in California” (June 2026), Exhibit D, page 4.
Table 1 as published, with ENB checks
| Field | Sq mi | Daily sun, GWh | Storage, TWh | Usable | GW | Sun on usable area, GWh/day [ENB] | GW x 5 h, GWh [ENB] |
| Midway-Sunset | 80 | 2,280 | 6,971 | 35% | 401 | 798 | 2,005 |
| Belridge | 50 | 1,425 | 2,905 | 80% | 382 | 1,140 | 1,910 |
| Elk Hills | 49 | 1,397 | 2,846 | 25% | 117 | 349 | 585 |
| Kern River | 25 | 713 | 2,905 | 30% | 143 | 214 | 715 |
| Kern Front | 24 | 684 | 1,394 | 45% | 103 | 308 | 515 |
| Lost Hills | 16 | 456 | 1,394 | 50% | 115 | 228 | 575 |
| Cymric | 10 | 285 | 1,162 | 40% | 76 | 114 | 380 |
| Coalinga West | 16 | 456 | 2,788 | 40% | 184 | 182 | 920 |
| Coalinga East | 6 | 171 | 1,046 | 50% | 86 | 86 | 430 |
| Sum (as published) | 276 | 7,866 | 23,411 | 1,608 | 3,419 [ENB] | 8,040 [ENB] |
Source: Umbro et al., SGP-TR-230 (2026), Table 1, page 5; ENB columns calculated from the published figures. In every field, five hours at the listed GW exceeds the sunlight on the usable area.
Appendix G. Data gaps
- No measured efficiency, temperature or power data from the PRM site are public.
- No PRM levelized cost or all-in capital cost beyond the $2 billion endnote.
- No public reserve report for the 40 million barrel figure.
- No public source located for USC Marshall data center rankings, the “90 GW” CAISO figure, or the 313/18/4 permit split.
- No PNNL study of sandstone oil-field GeoTES located; PNNL’s related work is on fracture thermal storage in crystalline rock (PNNL). INL’s Phase I GeoTES report is here; NLR’s earlier techno-economic work is here, here and here; the 2025 review is here.
- No polling or investor commentary specific to GeoTES.

