


The summer of 2026 tested the U.S. electric grid with record heat and rising demand. According to the U.S. Energy Information Administration’s Hourly Electric Grid Monitor (based on Form EIA-930 data), three major regional transmission organizations (RTOs) set new peak hourly load records.Eia
- PJM (serving roughly 65–67 million people across all or parts of 13 states plus Washington, D.C.) peaked at 162.6 GW on July 2, 2026—1.3% above its prior record of 160.6 GW (June 23, 2025).
- ERCOT (primarily Texas) peaked at 91.1 GW (91,134 MW) on July 22, 2026—6.5% above its prior record of 85.5 GW (August 20, 2024). Demand exceeded the previous all-time record in 187 separate hours across 34 days, with multiple days above 90 GW.
- SPP (Southwest Power Pool, covering parts of 14+ states in the central U.S., including recent western expansion) peaked at 58.0 GW on July 27, 2026—3.5% above its prior record of 56.0 GW (August 21, 2023).
Most peaks coincided with regional heat waves during the hottest summer on record nationally, which drove cooling demand. Other grids came close: CAISO and ISO-NE within 2% of records, NYISO within 3%, and MISO within 4%.Eia
Where Do We Go From Here?
These records reflect structural load growth from data centers (especially AI-related), electrification, and warmer weather, on top of traditional seasonal peaks. PJM’s independent market monitor has linked data center load to sharp rises in wholesale costs and capacity prices. Existing and forecasted data center load has contributed billions in capacity market revenues across recent auctions (which have cleared at or near caps around $325–$329/MW-day).Utilitydive
Looking ahead, grids need more dispatchable capacity (natural gas, potentially nuclear), faster interconnection of renewables and storage, transmission expansion, and stronger demand response. ERCOT’s experience shows solar and batteries can ease daytime peaks, while SPP’s wind fleet provides substantial energy (often the largest share seasonally). PJM faces tighter conditions amid slower new supply relative to load forecasts and planned retirements. FERC has ordered RTOs, including these three, to justify or reform rules for large loads like data centers.
Analysts and the EIA project continued pressure. EIA’s Short-Term Energy Outlook forecasts 2026 wholesale prices averaging about $52/MWh nationally (up 11% from 2025), with PJM seeing the largest regional increase at roughly 41%.Eia Capacity costs in PJM are a key driver of retail pressure.
Blackout Warnings and Reliability
All three operators issued reliability advisories, alerts, or faced emergency conditions tied to heat, outages, or maintenance this year—more frequently than in quieter periods.
- PJM has repeatedly used emergency procedures, including Demand Response activations on multiple days in 2025–2026. In mid-October 2026, unseasonal warmth plus heavy planned maintenance (over 60,000 MW offline at one point) prompted Maximum Generation and Load Management Alerts, plus a Department of Energy (DOE) Section 202(c) emergency order authorizing additional generation and backup resources through October 16. PJM noted demand growing faster than new supply, with fewer windows for maintenance.Fox News
- SPP issued Conservative Operations Advisories and Resource Advisories during summer heat, with DOE emergency orders in late July authorizing specified and backup generation amid forecasts near or at record peaks and lower renewable output risk. At one point, it approached Energy Emergency Alert Level 3 conditions in its western footprint, warning of potential rolling blackouts (none ultimately ordered). Similar advisories continued into fall.Spglobal
- ERCOT set numerous records without statewide conservation appeals or grid-wide emergencies this summer—unlike 2023. Solar growth (monthly solar often exceeding 18% of generation in peak summer months), wind, and batteries (discharging in evening ramps) helped cover incremental load, with clean-power growth outpacing overall demand.Texas2036
The systems largely held without widespread customer blackouts, but operators and DOE have intervened more often to maintain reserves. Tight conditions highlight the need for both supply additions and operational flexibility.
Should Customers Prepare?
Yes. While the grids avoided major interruptions this summer, rising peaks, data center growth, and maintenance windows mean more frequent alerts are likely. Customers can:
- Monitor ISO/RTO alerts and participate in voluntary conservation or demand response programs when called.
- Improve efficiency (HVAC, insulation, appliances) and consider smart thermostats or time-of-use rates.
- In retail choice states (much of PJM, parts of others), shop competitive supply rates.
- For critical loads, evaluate backup power (generators or batteries), especially in areas prone to local outages.
Preparation focuses on resilience and cost management rather than expecting routine blackouts.
Energy Mix
Natural gas was the top resource during all three record peak hours: about 43.3% in PJM, 47.4% in ERCOT, and 44.0% in SPP.X Broader mixes differ by region and season.
Approximate recent/typical shares (drawing from operator data, snapshots, and seasonal reports):
- PJM: Natural gas often 40–45%, nuclear ~25–30%, coal ~15–20%, with smaller but growing wind/solar/hydro. Dispatchable resources (gas, coal, nuclear) dominate peaks.
- ERCOT: Natural gas ~40–50% overall, with strong solar (record summer shares >18% in peak months), wind ~15–25%, coal and nuclear lower, and rising battery storage that charges midday and discharges in the evenings.
- SPP: Wind frequently the largest share (30–45%+ in many periods, especially East), followed by natural gas and declining coal, with growing solar and some hydro/nuclear.
Here are illustrative pie charts based on recent operational data and seasonal patterns:
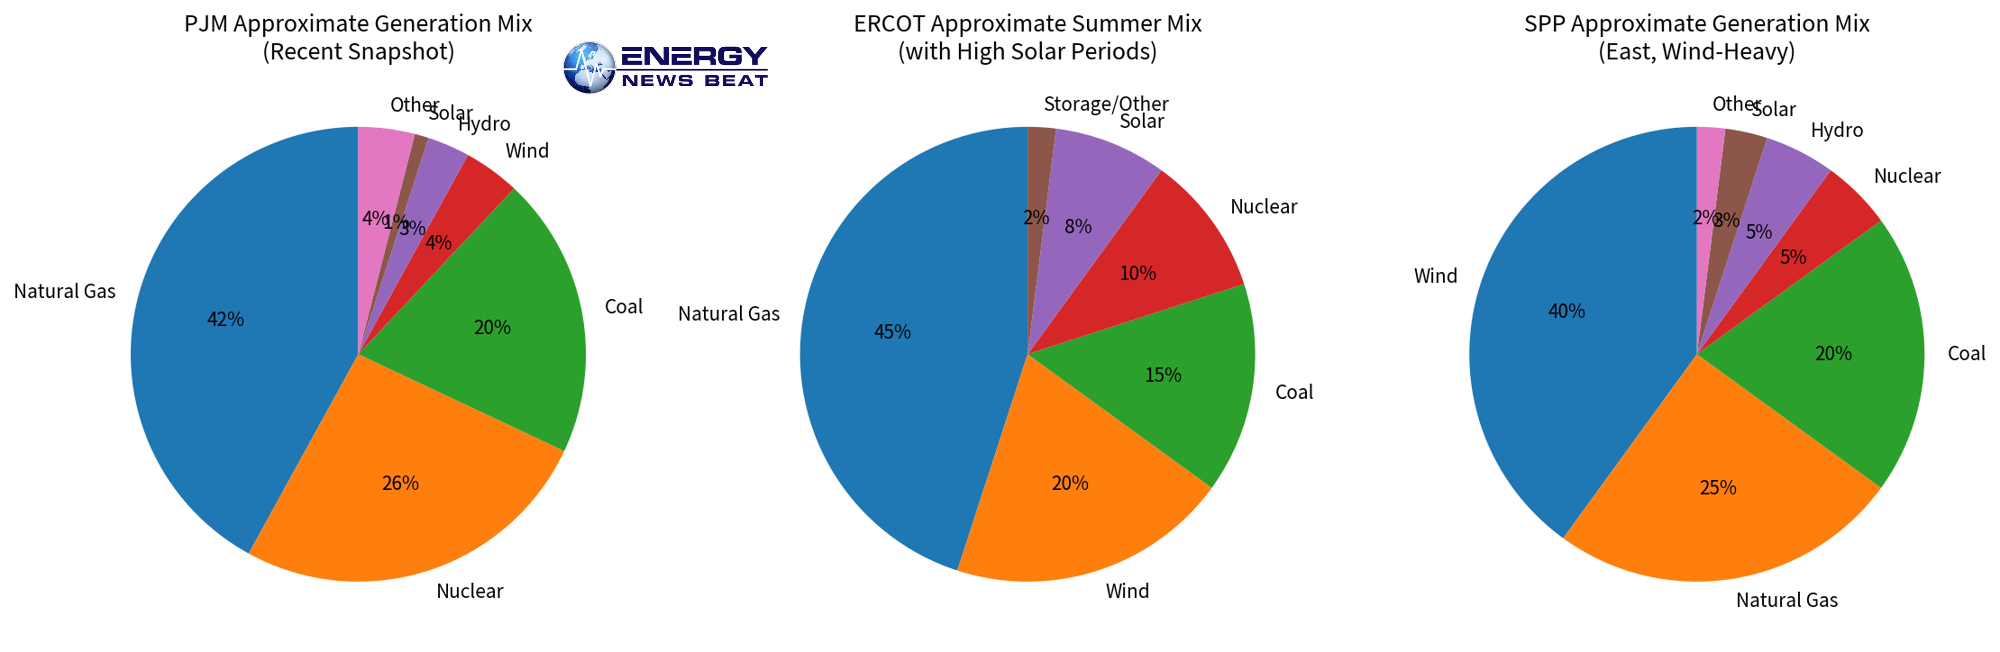
Exact mixes vary hourly and by weather; real-time data is available from each operator’s portals and EIA’s Hourly Electric Grid Monitor.
Electricity Rates and How Regions Stack Up
Residential rates (EIA Electric Power Monthly, July 2026 averages, preliminary) vary widely. U.S. residential average was about 18.31 ¢/kWh (up ~4.9% year-over-year). ERCOT and SPP-area states generally run lower than many PJM states.
Selected July 2026 residential rates (¢/kWh):
- Texas (ERCOT): ~15.88
- Oklahoma (SPP): ~14.35
- Kansas (SPP): ~15.27
- Pennsylvania (PJM): ~21.72
- Ohio (PJM): ~19.45
- Illinois (PJM): ~19.22
- New Jersey (PJM): ~25.19
- Maryland (PJM): ~21.41
SPP plains states often benefit from abundant wind, coal, and gas; ERCOT from competitive markets and gas/renewables; PJM from higher capacity costs, nuclear/coal mixes, and denser load centers. Year-over-year increases were notable in several PJM states (e.g., double-digit in PA, OH, MD, IL).Theenergycollective
Comparative chart:
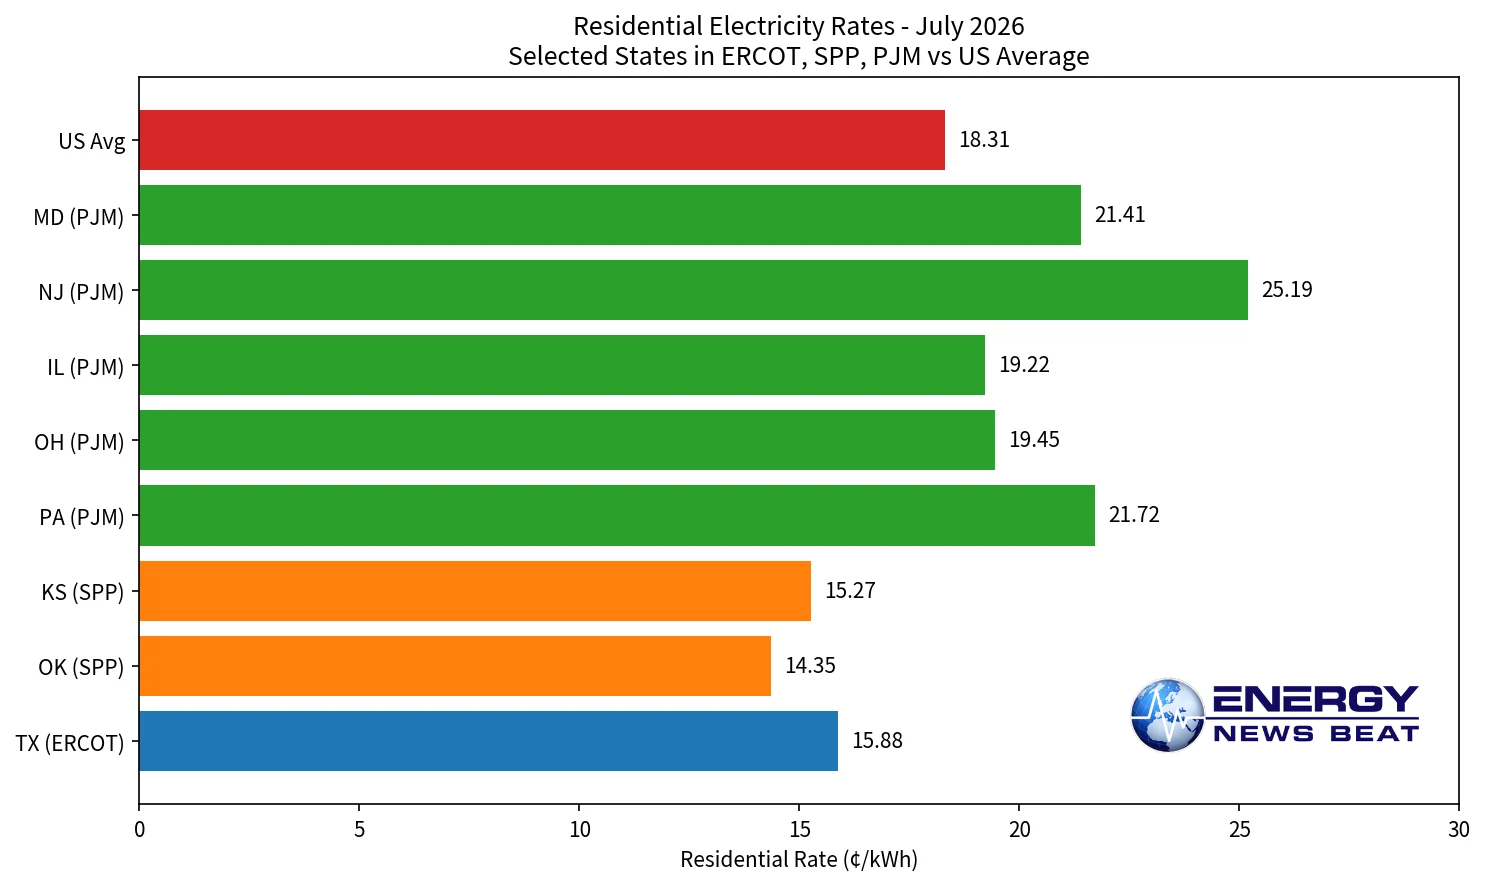
Wholesale and capacity costs are rising faster in PJM, which analysts expect will flow into retail bills over time. Commercial and industrial rates follow similar regional patterns but are typically lower.
Analysts on Price Increases
EIA and market monitors point to weather, rising demand (especially data centers), and constrained supply as drivers. PJM wholesale prices saw large jumps in 2026; capacity auctions clearing at high levels (near caps) add structural pressure that Monitoring Analytics has tied primarily to data center load growth. ERCOT prices have been more moderated by solar and storage in daytime hours, though evening ramps and large-load queues remain concerns. SPP has managed growth with its wind base and western expansion but faces similar long-term demand pressures.
Overall, expect continued upward pressure on rates in tight regions unless new generation and transmission keep pace with load. Customers in competitive markets can mitigate some exposure by shopping; all can reduce usage through efficiency. And plan on more potential rolling blackouts as demand increases and more intermittent power sources are added during the “Bum Rush for Subsidies as Stu Turley has said on the Energy News Beat Podcast. We have had several large near-miss blackouts, and it is only a matter of time.
Check out the World’s Greatest Podcast Show Notes at EnergyNewsBeat.co or EnergyNewsBeat.com. And subscribe to: The Energy News Beat Substack.
Appendix: Sources and Links
- EIA Today in Energy: “PJM, ERCOT, and SWPP all set peak load records this summer” (Oct. 15, 2026) — https://www.eia.gov/todayinenergy/detail.php?id=68305
- CleanTechnica summary of the same EIA data — https://cleantechnica.com/2026/10/15/pjm-ercot-and-swpp-all-set-peak-load-records-this-summer/
- Texas 2036 analysis of ERCOT summer reliability (no conservation calls) — https://texas2036.org/news-analysis/texas-ercot-grid-passed-the-reliability-test-this-summer/
- ERCOT summer operational reviews and peak records pages (e.g., https://www.ercot.com/static-assets/data/news/content/a-peak-demand/2026/all-time-records.htm and board materials)
- Richard Meyer (AGA) post on peak-hour natural gas shares — X/Twitter data referenced in coverage
- DOE emergency orders and PJM/SPP alerts (multiple reports, including Fox News, Benzinga, S&P Global, Reuters on July SPP conditions and October PJM order)
- EIA Short-Term Energy Outlook (wholesale price forecasts, Oct. 2026) — https://www.eia.gov/outlooks/steo/
- Monitoring Analytics / Utility Dive reports on PJM data center impacts and capacity costs
- EIA Electric Power Monthly Table 5.6.A (residential prices by state, July 2026 data released Sept. 2026)
- Operator portals: pjm.com, ercot.com, spp.org for real-time mixes, alerts, and historical data; EIA Hourly Electric Grid Monitor
Data are preliminary in places and subject to final settlement. For real-time or latest figures, check the operators and EIA directly.

