

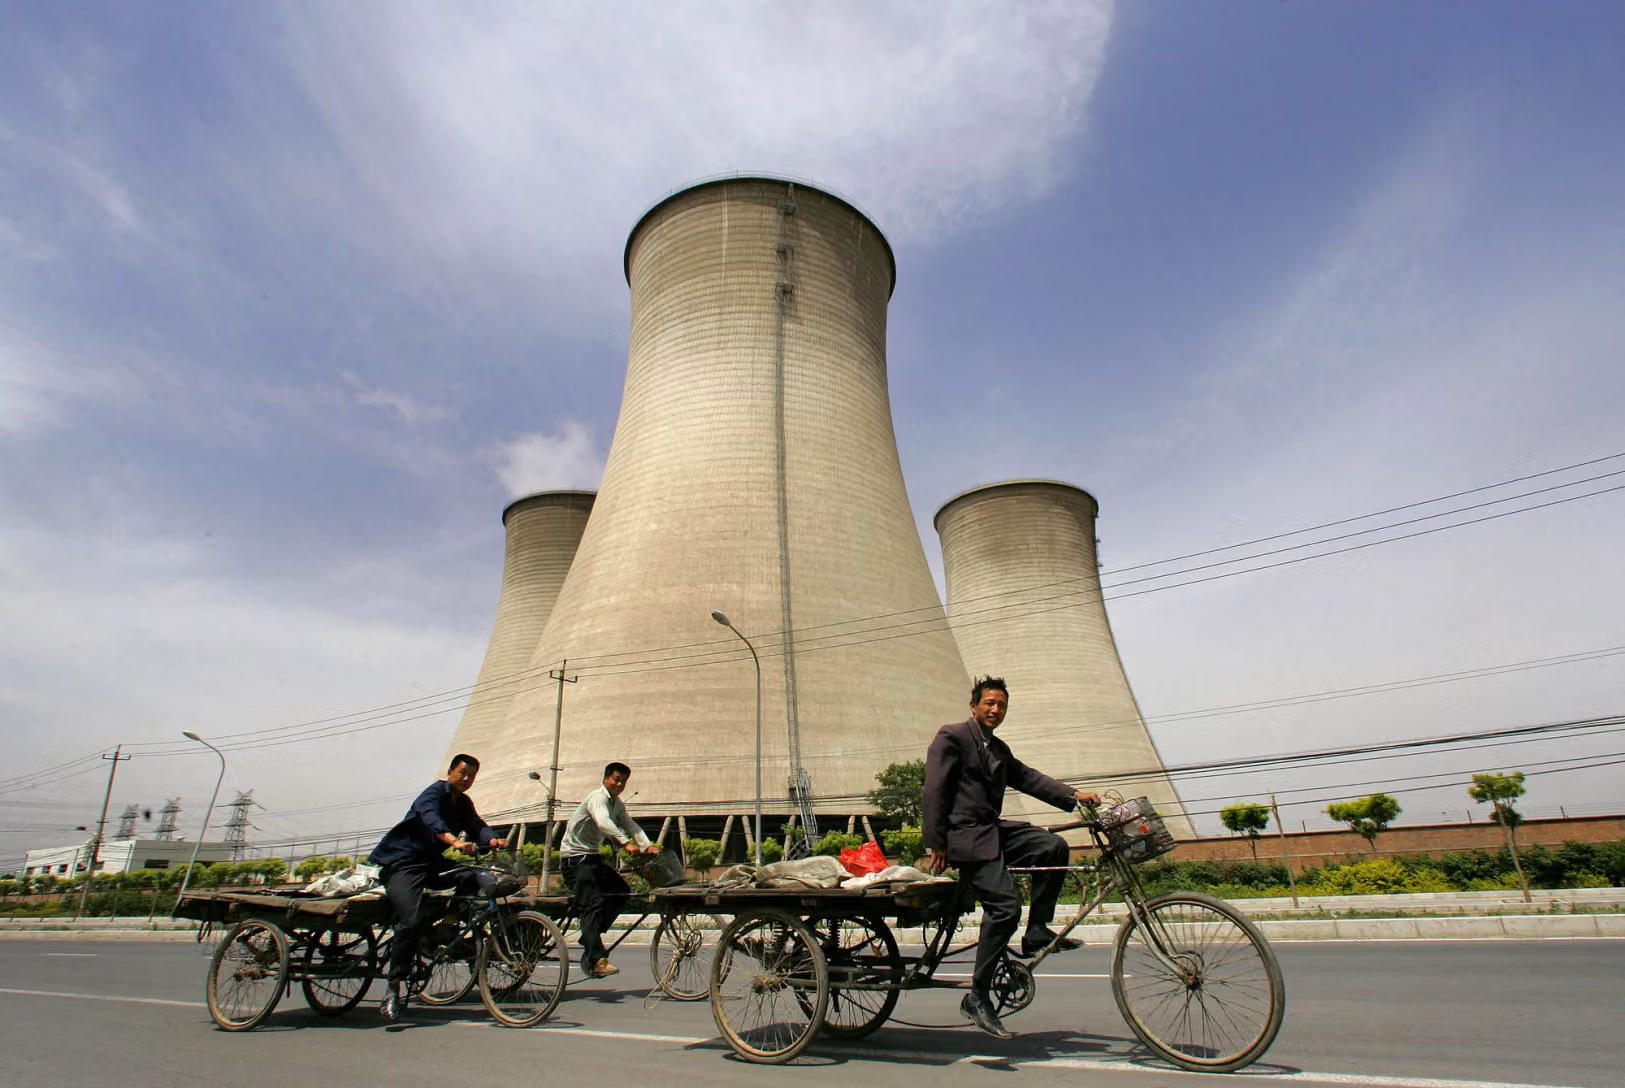
How a policy sold as climate leadership transferred industrial power, energy security, and emissions to Beijing.
David Blackmon put it as bluntly as anyone in energy journalism has: every facet of the West’s net-zero obsession and taxpayer-subsidized “energy transition” is designed, in practice, to benefit one country. That country is China.
On September 20, 2026, Blackmon highlighted a Tablet Magazine essay by Michael Doran and Brenda Shaffer—“China’s Net Zero Advantage”—as a must-read that is “right on basically every point.” Their argument is the one much of the climate establishment still refuses to face: America holds a natural advantage in abundant oil and cheap natural gas. That advantage powers factories, data centers, transportation, and the military. China, dependent on imported oil and gas, cannot easily match it. Beijing’s workaround is the Western Net Zero machine.
That is not a conspiracy theory. It is arithmetic.
China adds. The West subtracts.
Doran and Shaffer describe an alliance in all but name. A well-funded Western network of NGOs, philanthropies, research institutes, international agencies, journalists, officials, and financial institutions campaigns to restrict fossil-fuel production and use at home. China is spared the same treatment even though it is the world’s largest greenhouse-gas emitter and the largest producer and consumer of coal.
The numbers are not subtle. China burns more coal than the rest of the world combined. In 2024 it accounted for about 55.8 percent of global coal consumption and 51.7 percent of global coal production. In that same year it began construction on 94.5 gigawatts of new coal-fired plants—93 percent of all new coal construction on Earth. IEA data into 2025–2026 still show China consuming more than half of the world’s coal, on the order of 4.95 billion tonnes a year, while global coal demand sets new records.
Western emissions, meanwhile, have fallen. The United States cut CO2 emissions by about 13 percent since 2010; the EU cut them by more than a quarter since 2000; the UK closed its last coal plant. China added more than 3 billion tons of CO2 a year—an increase larger than the EU’s entire output—while expanding fossil fuels and renewables. Global fossil CO2 is still at record highs. China accounts for roughly one-third of the total. The atmosphere does not care which jurisdiction prints the press release.
Doran and Shaffer put the industrial consequence in one sentence: “Climate policy, as practiced, is a transfer of industrial advantage to China.” When the West subtracts dispatchable power faster than replacements arrive, electricity becomes expensive. Factories that compete on energy cost—steel, chemicals, glass, autos, data centers—shrink, move, or die. The replacement systems are Chinese. China dominates solar manufacturing, battery cells and materials, critical-mineral processing, and a growing share of electric vehicles. A transition mandated by Western governments transfers demand to Chinese factories and control of supply to Chinese planners.
The emissions do not vanish. They change jurisdiction and often get dirtier. A steel coil, battery, solar module, or EV once made under Western rules is now made on a grid that still runs heavily on coal. Western countries report a decline on their own books. The atmosphere records the transfer.
Cheap power in China, expensive power in Europe
Industrial electricity prices tell the same story. Doran and Shaffer cite manufacturing costs in Germany 40–50 percent higher than in China, with European industrial power around 20 cents per kWh versus 6–8 cents in China. IEA tracking through 2025 still shows EU prices for energy-intensive industry roughly double U.S. levels and about 50 percent above China. UK industrial power has been among the highest in the OECD—often more than double European peers and several times U.S. or Chinese rates.
That is not an accident of geology. It is policy: carbon prices, renewable levies, grid charges, bans on new dispatchable capacity, and political hostility to nuclear in parts of Europe. Reliability has suffered with cost. An April 2025 Iberian blackout affecting tens of millions was cited as a warning of renewable-heavy grids without enough firm power.
China’s strategy is the opposite of net-zero subtraction. It adds wind, solar, hydro, and nuclear without retiring coal, oil, or gas at the same pace. Nuclear is the clearest contrast. The United States remains the largest nuclear generator, but China is building at a scale no Western country matches. World Nuclear Association data show China with dozens of reactors under construction—on the order of 38 units and nearly 40 GWe in the pipeline—while the mainland’s operable-plus-under-construction-plus-approved fleet has become the world’s largest by total scale. Coal remains the ballast. Nuclear and renewables are additive capacity, not a substitute that shuts the mines.
Western climate diplomacy often treats this as leadership. John Kerry once said Uyghur forced labor in Xinjiang—where much solar-grade polysilicon originates—was “not my lane.” Christiana Figueres praised China for under-promising and over-delivering. The result is a market written into Western law and underwritten, in part, by Western taxpayers, for goods China already dominates. IEA figures cited in the Tablet piece put China at about 80 percent of global manufacturing capacity for solar and battery inverters in 2025. That is not just a trade issue. It is a grid-security issue.
Manufacturing did not “transition.” It moved.
Over two decades, the center of global manufacturing shifted east.
Around 2005, China held roughly 9 percent of world manufacturing value added. By 2025, that share was about 27–28 percent—larger than the United States or the European Union. The EU’s share fell from about 24 percent to about 17 percent; Japan’s from 13 percent to about 5 percent; the U.S. share slipped from the low 20s to the mid-to-high teens. Combined, the U.S., EU, and Japan went from nearly 60 percent of global manufacturing in 2005 to under 40 percent two decades later.
Inside Western economies, the picture is the same. U.S. manufacturing’s share of GDP has fallen from the low-to-mid teens in the mid-2000s toward about 10 percent. China’s manufacturing share of its own GDP remains in the mid-20s. Energy-intensive British industry is a cautionary case: output in several heavy sectors is a fraction of early-2000s levels; steel production collapsed; chemicals, cement, glass, and refining have shrunk or closed under high power prices and carbon costs. German energy-intensive production fell sharply after 2022. Volkswagen’s European retrenchment and Chinese EV brands taking a visible slice of EU registrations are not cultural stories. They are power-price and industrial-policy stories.
China did not win this by “abiding by net zero.” It won by keeping coal as baseload, building nuclear at wartime pace by Western standards, flooding export markets with subsidized solar, batteries, and EVs, and letting Western governments mandate the demand.
Energy security was treated as optional
Europe learned from Russian gas what a single choke point costs. Renewable supply chains have more of them: polysilicon, wafers, cells, inverters, battery chemicals, processed rare earths. After Ukraine, the West discovered that “green” hardware is a Chinese industrial stack sitting on a coal pile. Doran and Shaffer note the security implication that pipelines never presented in the same way: concentrated manufacturing of inverters and grid electronics in one rival state.
The United States still has a structural advantage—oil, gas, and a more competitive industrial power price than Europe. That advantage is real only if policy does not throw it away. Bans on development, forced premature retirement of firm generation, and procurement rules that treat Chinese modules as climate virtue recreate Europe’s problem on this side of the Atlantic.Net zero was sold to Western leaders as moral leadership and future industry. What arrived was higher household and industrial bills, weaker grids, shuttered plants, and a transfer of the very industries the transition was supposed to create.
Relative economic weight: 20 years, through 2026
The West did not suffer an absolute collapse in GDP. Services, technology, and (in the United States) oil and gas kept headline output growing. What declined is relative weight, industrial capacity, and growth speed compared with China.
On a purchasing-power basis, China’s share of world GDP rose from about 9.5 percent in 2006 to roughly 19–20 percent in 2026, making it the largest economy in PPP terms. The United States remains the largest in nominal dollars—on the order of $31–32 trillion in 2026 versus China’s roughly $20–21 trillion—but the gap in growth rates has been persistent. IMF-style outlooks around April–July 2026 cluster U.S. real growth near 2.1–2.3 percent in 2026, the euro area near 0.9–1.2 percent, Germany often below 1 percent, the United Kingdom near 1 percent, and China still near 4.4–5.0 percent even after its slowdown from double-digit years. Advanced-economy growth over the last two decades has typically averaged 1.3–2 percent a year; China’s compounding from a lower base is why its share of world output doubled.
That is the macroeconomic backdrop to deindustrialization. Slow Western growth plus high energy costs plus offshoring of heavy industry is not “decoupling emissions from GDP” in the way brochures claim. It is often decoupling production from Western GDP while emissions follow the factories.
The point people are not aware of
Blackmon’s service in amplifying Doran and Shaffer is to name the mechanism. Net Zero, as practiced, is not a symmetric global carbon diet. It is a Western political project that subtracts firm energy and industry at home, praises China as a “climate leader,” and then imports the coal-powered substitutes.
People are told the environment wins if a blast furnace closes in Germany or a refinery closes in Britain. The atmosphere sees the steel and fuels arrive from a system that added 94.5 GW of new coal plants in a single year and still consumes more coal than everyone else combined. People are told the West is building the industries of the future. The supply chain of that future is already concentrated in the country that refused to play by the same rules.
Doran and Shaffer close with a national-security test that energy reporters should use as a checklist: look at the numbers, the industrial gains, the electricity prices, the dependence on a competitor, and whether the stated climate goal is actually being met. By that test, net zero has done more harm to Western industry and energy security than its advocates admit—and it has not delivered the global emissions outcome that justified it in the first place.
China understood energy first. Too many Western leaders understood messaging first. The bill is now visible in factory gates, power invoices, and the global coal charts.
As Stu Turley often says on the Energy News Beat Podcast, Energy Security Starts at home, and Energy Dominance is displayed through your Exports. China set the stage for energy as an export, and the United States redefined some of it. It would be great if the world worked together to improve humanity with the least impact on the environment.
Making Appendices Great Again
Check out the World’s Greatest Podcast Show Notes at EnergyNewsBeat.co or EnergyNewsBeat.com.
Subscribe to the Energy News Beat Substack: https://theenergynewsbeat.substack.com/
Appendix: Sources and links
Primary essays
- Michael Doran and Brenda Shaffer, “China’s Net Zero Advantage,” Tablet Magazine, September 16, 2026. https://www.tabletmag.com/sections/news/articles/china-netzero-advantage-climate
- David Blackmon, “X Post: How Every Facet of the West’s Net-Zero Obsession Benefits China,” September 20, 2026. https://blackmon.substack.com/p/x-post-how-every-facet-of-the-wests
Energy, coal, nuclear, prices
- IEA, Coal 2025 and mid-year coal updates (demand, China share, global totals). https://www.iea.org/reports/coal-2025/demand
- IEA, Electricity 2026 (industrial price comparisons). https://www.iea.org/reports/electricity-2026/prices
- World Nuclear Association, China reactor database. https://world-nuclear.org/nuclear-reactor-database/summary/China
- World Nuclear News / related plant commissioning reports (Changjiang-3 and construction pipeline).
- Ember, Global Electricity Review 2026 (coal and nuclear generation shares).
- Energy Institute Statistical Review (coal production/consumption shares cited in Tablet).
Emissions
- Global Carbon Project / Friedlingstein et al., Global Carbon Budget 2025.
- Carbon Brief analysis of 2025 fossil CO2. https://www.carbonbrief.org/analysis-fossil-fuel-co2-emissions-to-set-new-record-in-2025-as-land-sink-recovers
- EDGAR / JRC, GHG emissions of all world countries.
- U.S. EIA, energy-related CO2 (2025 preliminary).
Manufacturing and industry
- Visual Capitalist, world manufacturing shares 2005–2025. https://www.visualcapitalist.com/charted-the-worlds-top-manufacturers-2025-2025/
- Richard Baldwin et al. on U.S./EU deindustrialization and manufactured-export shares.
- UK Prosperity Institute and related UK energy-intensive industry reports on output, prices, and plant closures.
- Draghi Report / EU competitiveness analyses on energy costs and energy-intensive contraction.
- S&P Global on Western cleantech supply-chain dependence on China.
GDP and 2026 outlooks
- IMF World Economic Outlook and related 2026 updates (advanced-economy vs. China growth; PPP shares).
- StatisticsTimes / IMF-based 2026 GDP rankings (nominal and PPP).
- FOMC Summary of Economic Projections (U.S. real GDP).
- PwC Global Economy Watch projections (August 2026).
- UN DESA, World Economic Situation and Prospects 2026 September Update.
Authors’ related work
- Brenda Shaffer, pieces on World Bank fossil-fuel finance, African energy poverty, and Chinese EVs/solar as security risks (Macdonald-Laurier Institute, National Post, Real Clear Energy).
- Energy News Beat / David Blackmon archive on net-zero industrial consequences
