


A Nov. 19 post said fertilizer shipments through the Strait of Hormuz had fallen to zero and warned of another inflation wave. The chart stops in October. Urea cargoes have since started moving again, and U.S. nitrogen is mostly made at home. Phosphate and the 2027 planting bill are a tighter story.
Lukas Ekwueme, who writes on X as @ekwufinance, said fertilizer shipments through the Strait of Hormuz had accounted for about 20 percent of global fertilizer trade and had “fallen to zero.” Nitrogen fertilizer, he wrote, is “responsible for ~50% of global food production,” and less fertilizer plus less diesel would mean higher food prices and “another wave of inflation.”
The chart in that Nov. 19 post, credited to the World Trade Organization and AXSMarine, tracks AIS-traceable fertilizer shipments through the strait. It collapses after March, is plotted at zero in September and October, and notes that “the closure reaches 235 days.” The last point is October.
That lag matters. CNBC reported Friday that crude shipments through Hormuz have returned to roughly pre-war levels. That is a crude claim, not a fertilizer claim. By mid-November, urea cargoes were moving through the strait again, and about 300,000 metric tons were queued to leave, according to Green Markets on Nov. 18. Sulfur and anhydrous ammonia have lagged.
Most nitrogen on American farms is made at home from cheap natural gas, so the United States can absorb more of this than most importers in the short run. That is not insulation. Potash still comes mostly from Canada. Phosphate is tight. And USDA’s 2027 cost forecasts still put fertilizer at about $203 an acre for corn, against about $70 for soybeans. Diesel is the other weight on that bill, as Energy News Beat set out today in Diesel’s Winter Tug-of-War.
What the post got right, and what it didn’t
The 20 percent figure sits in a real range. The Center for Strategic and International Studies has put the strait at 20 to 30 percent of global fertilizer exports, including about 35 percent of urea. The WTO has used a higher figure, about a third of world fertilizer exports. Fertiglobe chief executive Ahmed El-Hoshy said at ADIPEC in November that 30 percent of globally traded urea and 47 percent of sulfur normally move through the waterway. Ekwueme’s “~20%” is a fair short-hand at the low end.
The 50 percent claim needs a tighter wording. In a 2008 Nature Geoscience paper, Jan Willem Erisman and colleagues, building on earlier work by Vaclav Smil, estimated that fertilizer from the Haber-Bosch process fed about 48 percent of the world’s population that year, and about 44 percent in 2000. Smil also estimated harvests would be about half as large without it, so the post is loose, not wrong; the standard phrase is “feeds about half the world.”
The zero claim is the one that has gone stale. The WTO-AXSMarine series in the post shows the AIS-traceable flow at zero in September and October, after a steep drop from early 2026. That does not match the mid-November tape. StoneX’s Josh Linville said reports of fertilizer vessels, including urea cargoes, were getting through a few times a week, though sulfur and ammonia flows remained disrupted. Green Markets, on Nov. 18, reported a $9-a-short-ton drop in New Orleans urea as about 300,000 tons waited to exit Hormuz amid better vessel availability. UK Maritime Trade Operations still counted overall Hormuz traffic about 65 percent below pre-conflict levels in mid-November.
A split price, and a split trade map
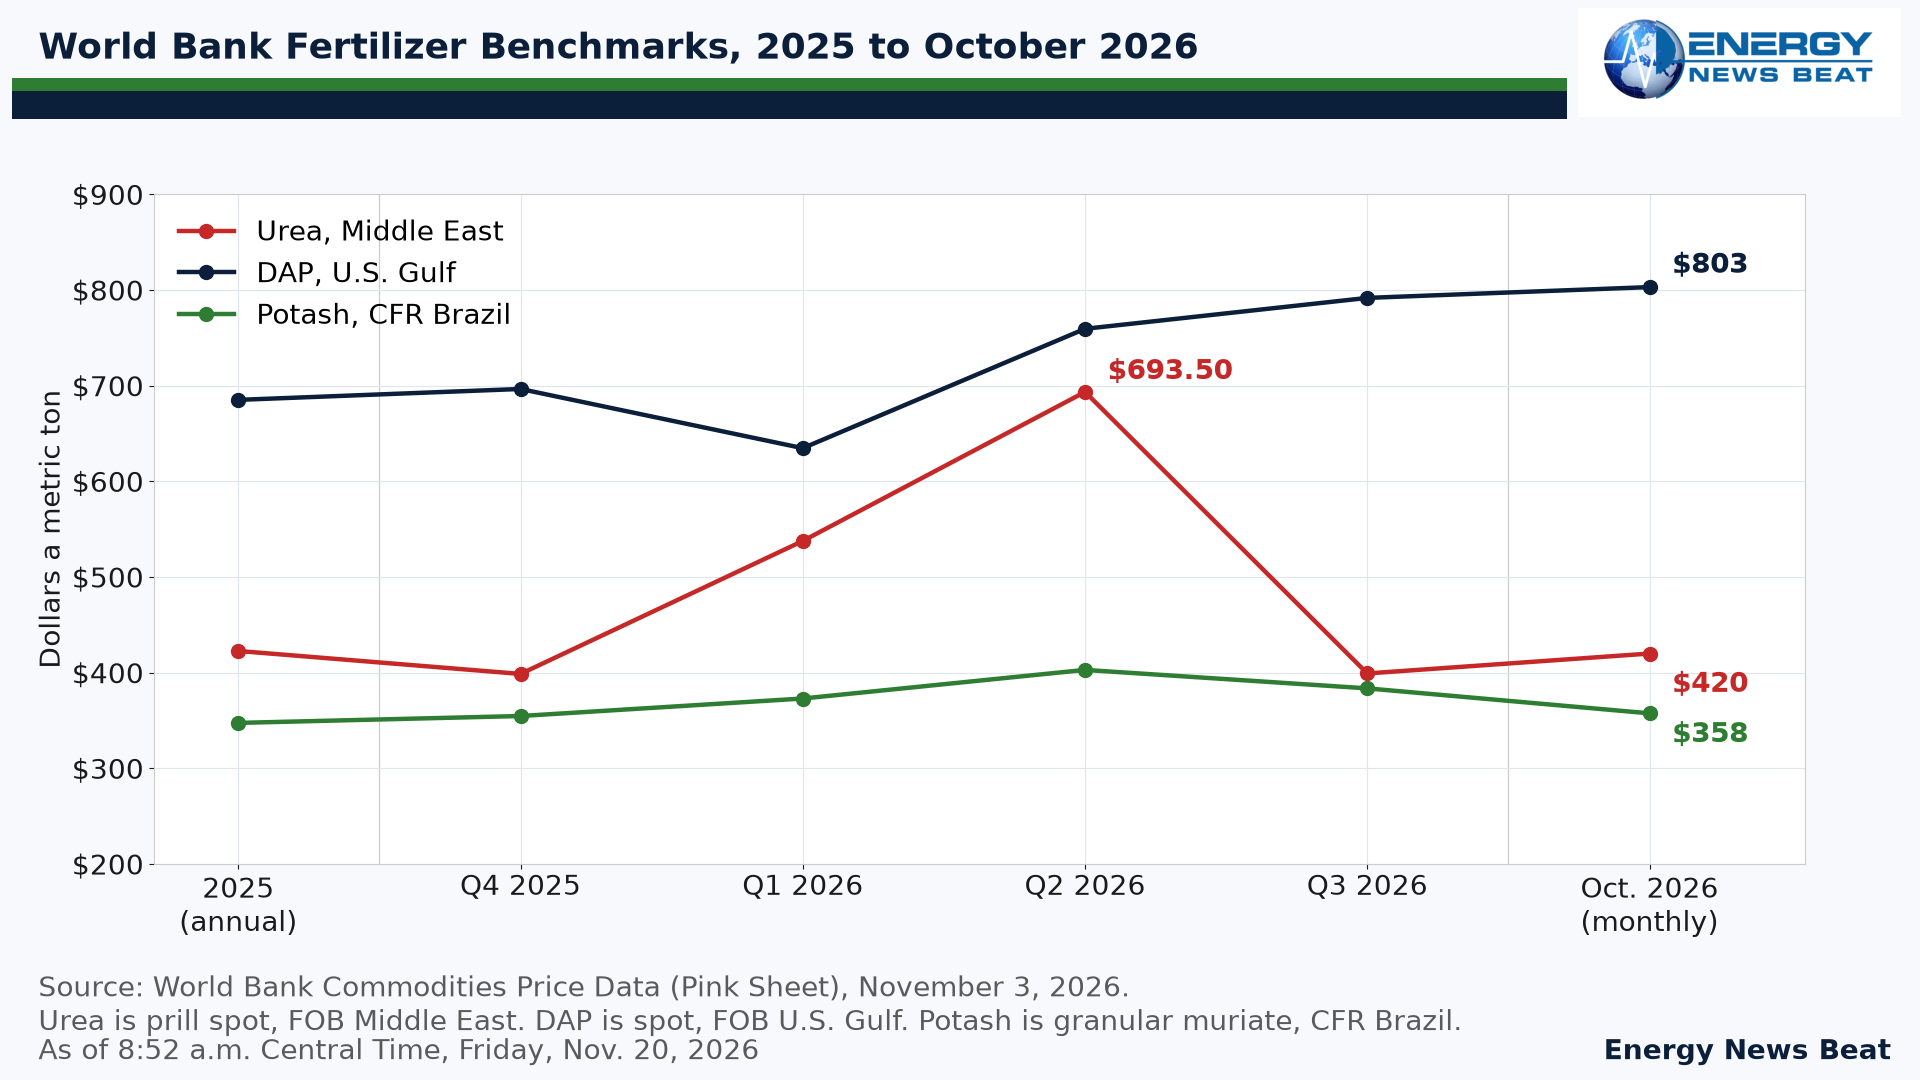
The official price board tells the same split story. The World Bank’s November Pink Sheet, with data through October, puts Middle East prilled urea at $420 a tonne, just above the $398.70 average in late 2025 and far below the $693.50 second-quarter spike. U.S. Gulf diammonium phosphate was $803.10 a tonne in October, up from $696.60 in late 2025. Potash, as granular muriate, CFR Brazil, was $357.50, a little above the 2025 average of $347.50. Green Markets quoted New Orleans urea at $415 to $429 a short ton, FOB, on Nov. 13, and New Orleans potash at $340 to $347.
The export map around the Gulf is why the recovery is uneven. Qatar, Saudi Arabia, Oman, Iran and the United Arab Emirates are major nitrogen and sulfur suppliers whose cargoes normally transit Hormuz; Egypt and other North African plants do not. China has kept phosphate exports tightly curbed this year, with trade reports of shipments near zero, while urea has still moved in official export windows. Russia remains a major global supplier of potash and nitrogen and supplied 12 percent of U.S. potash imports in 2021-24, behind Canada’s 79 percent, according to the U.S. Geological Survey. The European Union’s Carbon Border Adjustment Mechanism entered its definitive phase on Jan. 1, 2026, and covers imported ammonia, urea and other fertilizers.
Is the United States insulated? Are the new plants here yet?
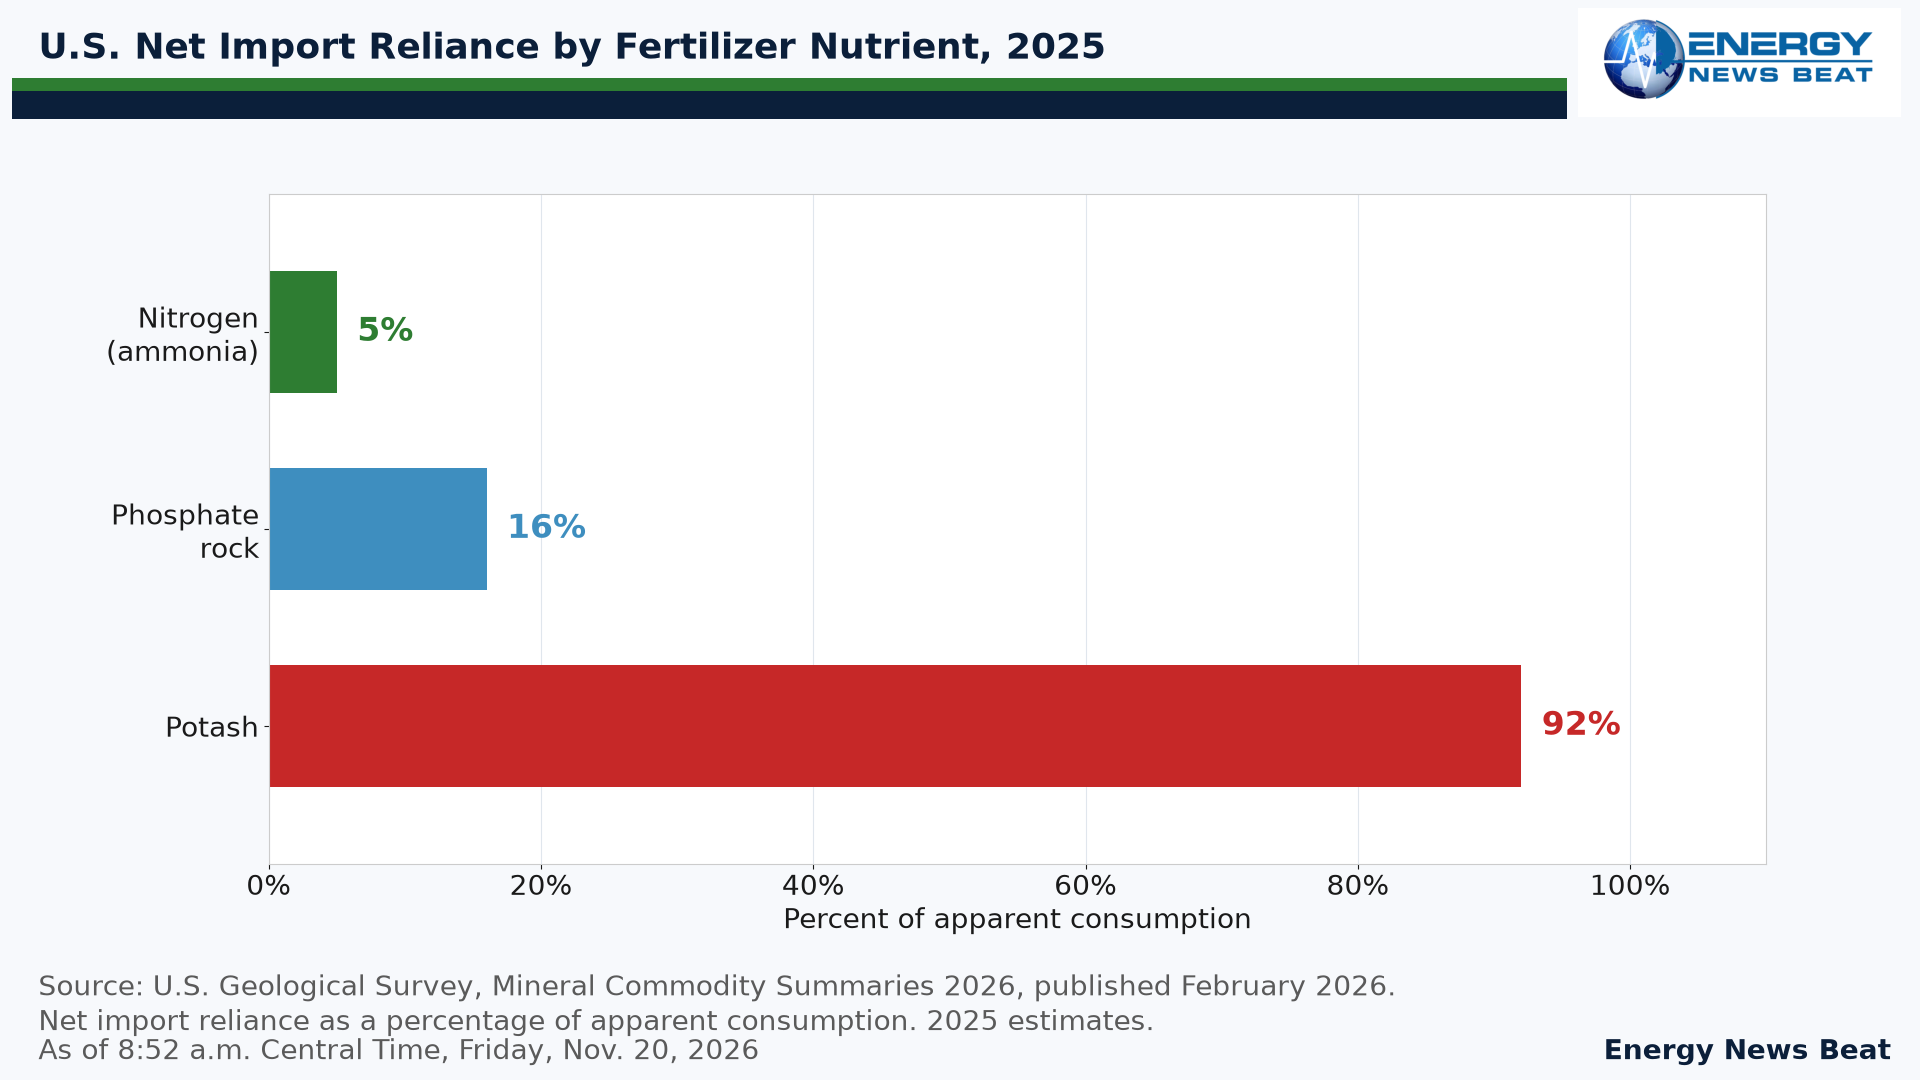
On nitrogen, the United States is closer to self-reliant than the warning implies. The USGS, in its February 2026 Mineral Commodity Summaries, estimated 2025 net import reliance at about 5 percent of apparent ammonia consumption. About 57 percent of U.S. ammonia capacity sits in Louisiana, Oklahoma and Texas, on domestic natural gas. Canada and Trinidad and Tobago supplied 49 percent and 47 percent of nitrogen imports in 2021-24.
Potash is the opposite. Net import reliance was about 92 percent in 2025, and Canada accounted for 79 percent of imports in 2021-24. Phosphate rock sits in the middle, with net import reliance of about 16 percent and almost all rock imports coming from Peru. Finished phosphate fertilizer is tighter. The United States suspended countervailing duties on Moroccan phosphate fertilizer in late June for up to eight months; duties on Russian phosphate remain in place. Nutrien said on Nov. 4 that it will shut White Springs, Florida, in the second quarter of 2027, while keeping Aurora.
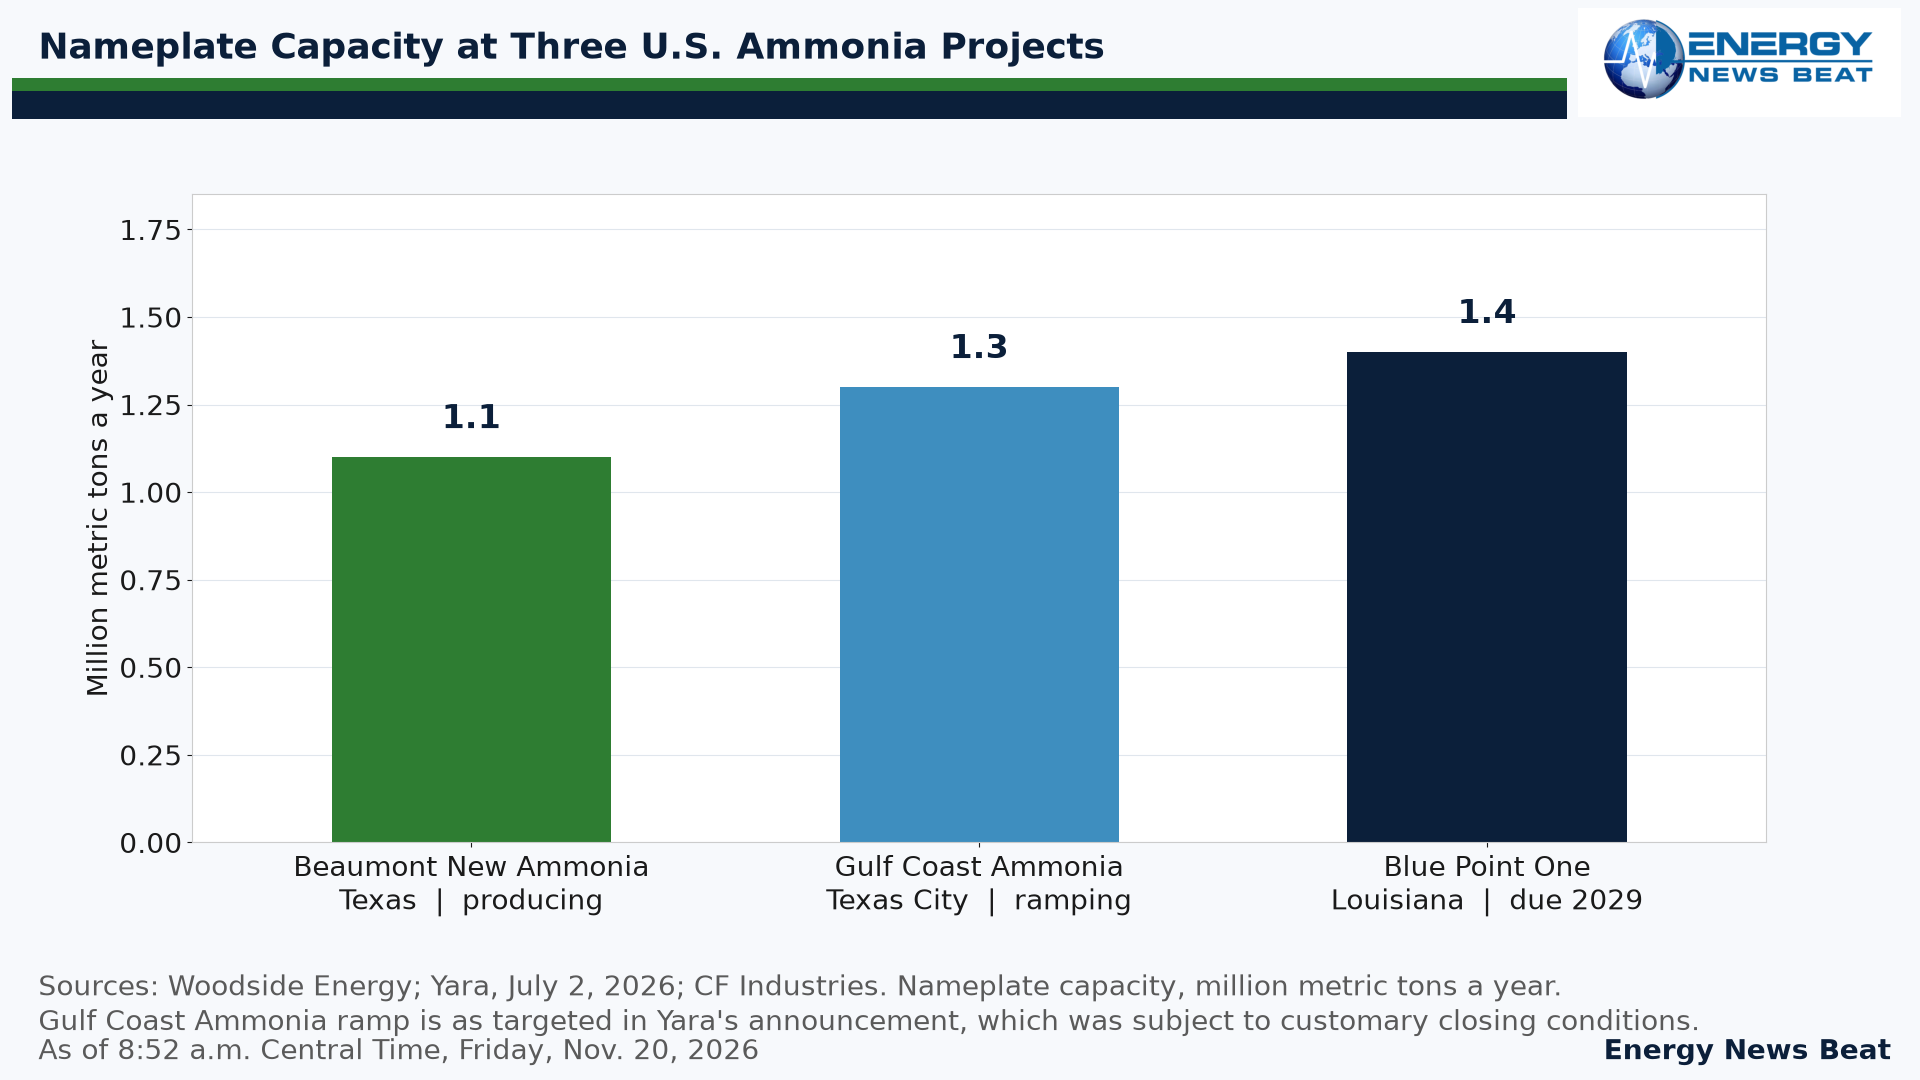
New U.S. plants are real, but they are not a switch that flips this winter. Woodside’s Beaumont New Ammonia plant in Texas, 1.1 million metric tons a year, produced first conventional ammonia in December 2025, and Woodside took operational control in March. Lower-carbon output is targeted for 2027, subject to Linde’s hydrogen units and ExxonMobil’s carbon storage. Yara agreed in July to buy the Gulf Coast Ammonia plant in Texas City, a 1.3-million-ton plant then in commissioning, with stable full-capacity operations targeted by the end of 2026. CF Industries, JERA and Mitsui began construction in August on Blue Point One in Louisiana, a 1.4-million-ton plant not expected to produce until 2029.
The farm bill, the 2027 planting math, and the grocery cart
USDA’s Economic Research Service, in its Sept. 3 forecast, put 2026 net farm income at $158.4 billion, down 2.6 percent from 2025. Fertilizer, lime and soil-conditioner expenses are expected to rise $5.3 billion, or 15.3 percent, and fuel and oil expenses $4.8 billion, or 28.8 percent. Direct government payments are forecast at $47.4 billion.
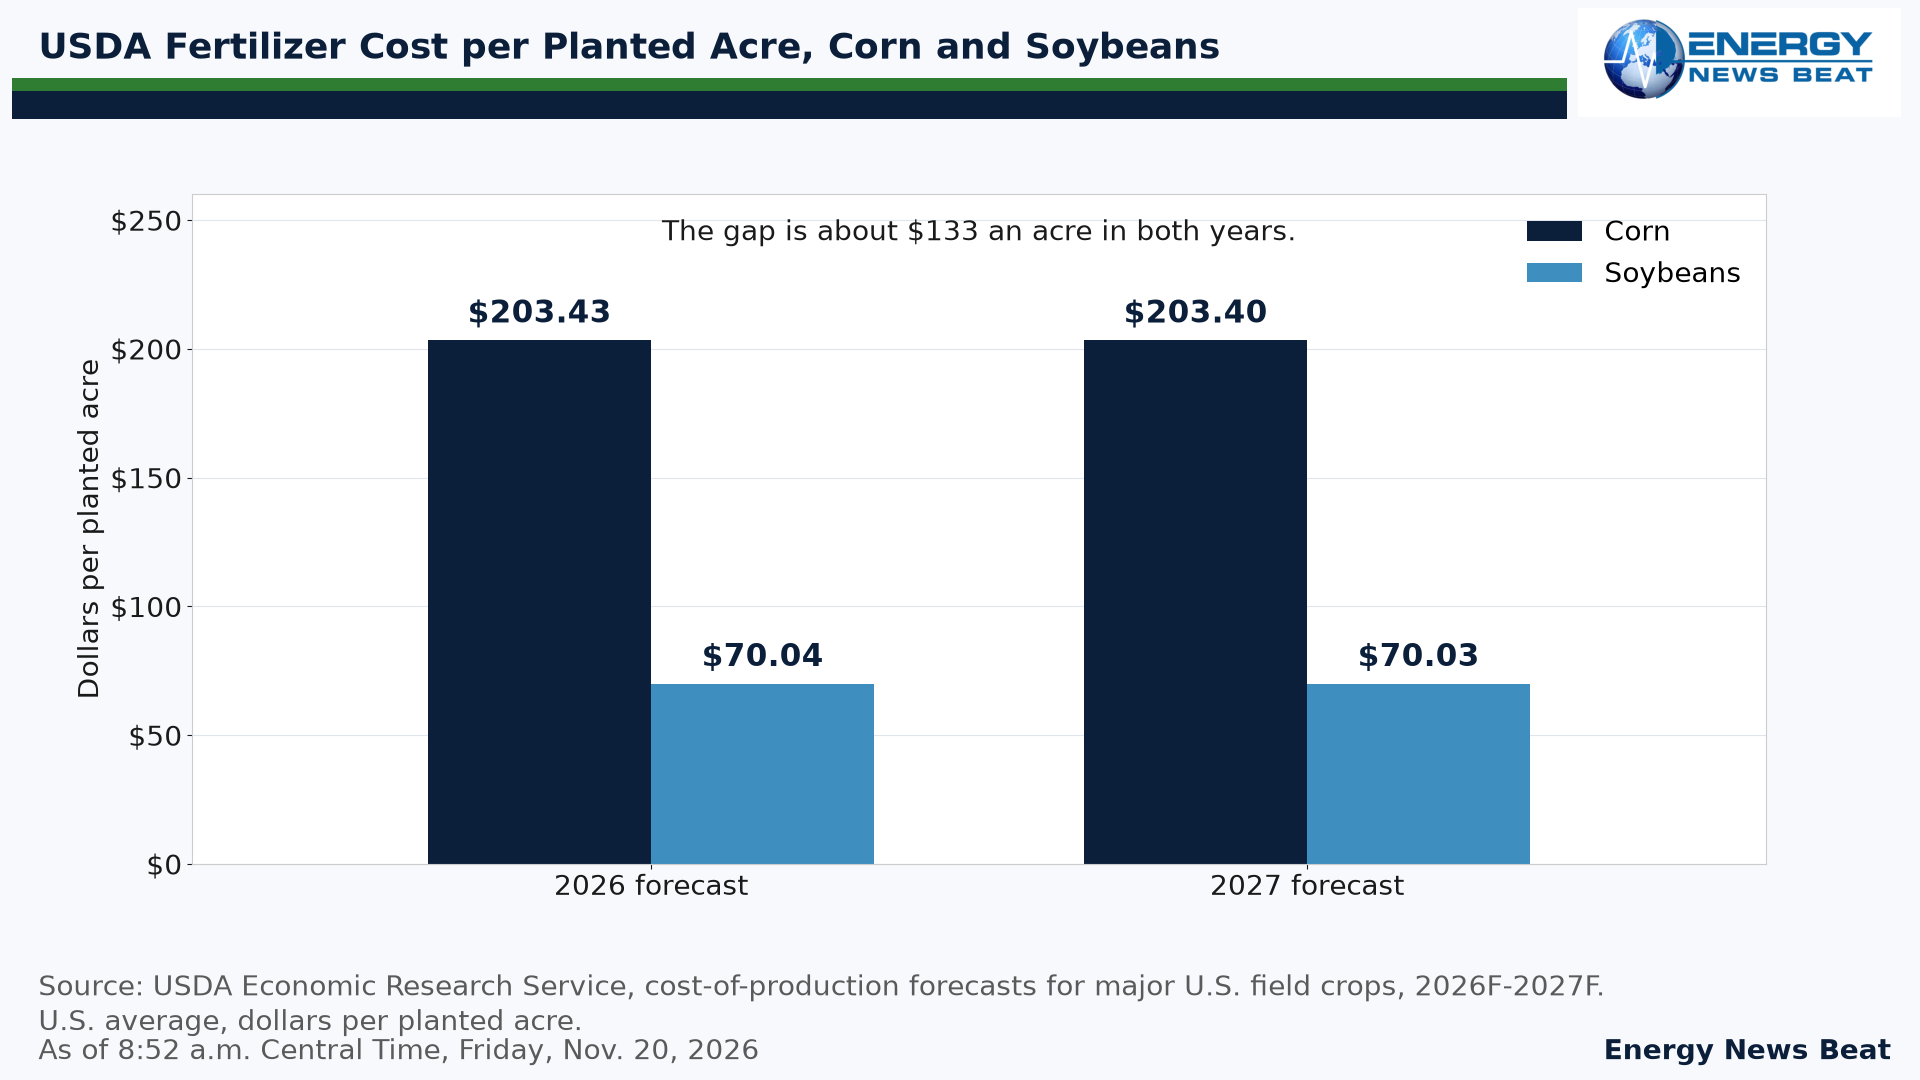
The 2027 budgets offer little relief on the fertilizer line. ERS cost-of-production forecasts put fertilizer at $203.40 an acre for corn and $70.03 for soybeans. That $133-an-acre gap is why high nitrogen and phosphate prices can still pull acres toward soybeans. The Purdue University-CME Group Ag Economy Barometer, surveyed Oct. 12-16 and published Nov. 3, rose to 126 from 123. High input costs remained the biggest concern.
Food is a real but limited slice of inflation. In the October CPI, food’s relative importance was 13.447 percent of the all-items basket, and food at home was 8.162 percent, both as of September weights. The food index rose 0.5 percent in October, seasonally adjusted, and food at home rose 0.4 percent. The Bureau of Labor Statistics could not publish October 12-month changes for most series, including food, because it has no October 2025 indexes after last year’s lapse in appropriations.
Consumer and Investor Views
For households, the test is the grocery aisle, not a single shipping chart. Food is about 13.4 percent of the CPI, and groceries about 8.2 percent. U.S. nitrogen is mostly domestic, so a Hormuz scare does not automatically empty American fertilizer bins, but tight phosphate and diesel costs can keep food production expensive.
For investors, the split is the point. CF Industries reported third-quarter net earnings of $436 million and said nitrogen fundamentals remain constructive into 2027. Nutrien posted third-quarter net earnings of $290 million and record potash sales volumes for the first nine months, and it plans to close White Springs in 2027. Mosaic is more exposed to phosphate. CVR Partners and LSB Industries are smaller U.S. nitrogen producers. Yara is adding Texas City capacity if that acquisition closes and ramps as planned.
Timeline
Key dates for the Hormuz fertilizer disruption, prices, U.S. plants and the farm outlook. Times are Central where a clock time is given.
Dec. 2025. Woodside’s Beaumont New Ammonia plant in Texas achieved first conventional ammonia production. Capacity is 1.1 million metric tons a year.
Feb. 28, 2026. Joint U.S.-Israeli strikes on Iran were followed by a de facto closure of commercial traffic through the Strait of Hormuz.
March 2026. Woodside assumed operational control of Beaumont New Ammonia.
April-June 2026. World Bank Middle East prilled urea averaged $693.50 a tonne in the second quarter, the highest quarterly average in the latest Pink Sheet.
June 29, 2026. The United States suspended countervailing duties on Moroccan phosphate fertilizer for up to eight months. Duties on Russian phosphate stayed in force.
July 2, 2026. Yara agreed to acquire the Gulf Coast Ammonia plant in Texas City, nameplate 1.3 million metric tons a year, then in commissioning, with stable full-capacity operations targeted by the end of 2026.
Aug. 26, 2026. CF Industries, JERA and Mitsui began construction of Blue Point One in Louisiana, 1.4 million metric tons a year, with production expected in 2029.
September-October 2026. A WTO-AXSMarine chart of AIS-traceable fertilizer shipments through Hormuz, later shared in the Nov. 19 post, is plotted at zero.
Sept. 3, 2026. USDA ERS forecast 2026 net farm income at $158.4 billion, with fertilizer expenses up 15.3 percent and fuel and oil expenses up 28.8 percent.
Oct. 12-16, 2026. Purdue-CME Ag Economy Barometer survey. The index later printed at 126, up from 123, with high input costs still the top concern.
Nov. 10, 2026. BLS said the October CPI food index rose 0.5 percent and food at home rose 0.4 percent, seasonally adjusted. Most 12-month changes were not published.
Nov. 18-20, 2026. Green Markets reporting pointed to renewed urea vessel moves through Hormuz and about 300,000 tons queued. Ekwueme’s post went up Nov. 19. CNBC on Nov. 20 said crude shipments through the strait were back to roughly pre-war levels.
Caveats and Criticism
The WTO-AXSMarine series in the Nov. 19 post is an index of AIS-traceable vessels, not a complete count of every fertilizer ton, and its last plotted month is October. Mid-November recovery is documented in market reports for urea, not in a new official monthly WTO table, and sulfur and ammonia have lagged. The CNBC item about pre-war flows refers to crude, not fertilizer.
Hormuz trade-share estimates range from about 20 percent of global fertilizer exports to about a third. The “feeds about half the world” figure is a 2008 population estimate from Erisman and co-authors, after Smil, not a 2026 production share. World Bank prices run through October. USGS import-reliance figures are 2025 estimates published in February 2026. Yara’s Texas City purchase was announced as subject to customary closing conditions. Blue Point production in 2029 is the companies’ current expectation. The ERS income forecast is dated Sept. 3. This is not investment advice.
Stu’s Take
The post was a step behind the market, not invented from whole cloth. Fertilizer through Hormuz did collapse after the war started, and the chart Ekwueme shared is plotted at zero in September and October. By mid-November, urea was moving again, even if ammonia and sulfur have not fully followed. The official urea price spiked in the spring and has since given much of it back. The United States is not sealed off, and it is not helpless. Nitrogen is largely made at home on cheap gas, and two Gulf Coast ammonia plants are adding tons this year and next. Potash still comes mostly from Canada. Phosphate is the sore spot, and USDA still sees about $203 of fertilizer on an acre of corn in 2027, against about $70 for soybeans. Watch the strait, China’s export windows, and that corn-soy math. Grocery inflation is not automatic, but a tight input market can show up at the rack and then in the cart.
Appendix A. Sources
Primary and contemporaneous sources used for this article, with access dates. Official price, import-reliance, farm-income, cost-of-production and CPI figures control the numbers in the text. The Nov. 19 social-media claim is quoted from the post and its attached chart. Accessed Nov. 20, 2026.
- Lukas Ekwueme (@ekwufinance), X post, Nov. 19, 2026, 17:04 GMT (11:04 a.m. Central Time), full text and attached World Visualized chart credited to WTO and AXSMarine, last plotted month October 2026. Accessed Nov. 20, 2026. https://x.com/ekwufinance/status/2123462329052393744
- CNBC, “Oil prices set for third straight weekly decline on Middle East export flows,” published Nov. 20, 2026, 12:01 a.m. ET, updated later Friday. States that crude shipments through the Strait of Hormuz have returned to roughly pre-war levels. Accessed Nov. 20, 2026. https://www.cnbc.com/2026/11/20/oil-wti-brent-hormuz.html
- World Bank, Commodities Price Data (The Pink Sheet), November 3, 2026, monthly averages through October 2026. Urea (E. Europe / prill spot FOB Middle East), DAP (spot FOB U.S. Gulf), potassium chloride (granular spot CFR Brazil), and U.S. and European natural gas. Accessed Nov. 20, 2026. https://thedocs.worldbank.org/en/doc/74e8be41ceb20fa0da750cda2f6b9e4e-0050012026/related/CMO-Pink-Sheet-November-2026.pdf
- U.S. Geological Survey, Mineral Commodity Summaries 2026, nitrogen (fixed)—ammonia, potash, and phosphate rock chapters, published February 2026, 2025 estimates. Accessed Nov. 20, 2026. https://pubs.usgs.gov/periodicals/mcs2026/mcs2026-nitrogen.pdf
- U.S. Geological Survey, Mineral Commodity Summaries 2026, potash. Net import reliance about 92 percent; import sources 2021-24: Canada 79 percent, Russia 12 percent, Israel 3 percent, other 6 percent. Accessed Nov. 20, 2026. https://pubs.usgs.gov/periodicals/mcs2026/mcs2026-potash.pdf
- U.S. Geological Survey, Mineral Commodity Summaries 2026, phosphate rock. Net import reliance about 16 percent; import sources 2021-24: Peru greater than 99 percent. Accessed Nov. 20, 2026. https://pubs.usgs.gov/periodicals/mcs2026/mcs2026-phosphate.pdf
- U.S. Department of Agriculture, Economic Research Service, Farm sector income forecast, updated Sept. 3, 2026. 2026 net farm income $158.4 billion; fertilizer, lime and soil conditioners up $5.3 billion, or 15.3 percent; fuel and oil up $4.8 billion, or 28.8 percent; direct government payments $47.4 billion. Accessed Nov. 20, 2026. https://www.ers.usda.gov/topics/farm-economy/farm-sector-income-finances/farm-sector-income-forecast
- USDA ERS, Cost-of-production forecasts for major U.S. field crops, 2026F-2027F, fertilizer, dollars per planted acre, U.S. total. Accessed Nov. 20, 2026. https://www.ers.usda.gov/media/4923/cost-of-production-forecasts-for-major-us-field-crops-2026f-2027f.csv
- U.S. Bureau of Labor Statistics, Consumer Price Index, October 2026, released Nov. 10, 2026; Table 1 relative importance as of September 2026 and seasonally adjusted one-month changes. Accessed Nov. 20, 2026. https://www.bls.gov/news.release/cpi.nr0.htm
- BLS, CPI Table 1, October 2026. Food relative importance 13.447 percent; food at home 8.162 percent. Accessed Nov. 20, 2026. https://www.bls.gov/news.release/cpi.t01.htm
- Purdue University-CME Group Ag Economy Barometer, October 2026 report, published Nov. 3, 2026, survey of 400 farmers Oct. 12-16, 2026. Index 126, up from 123 in September. Accessed Nov. 20, 2026. https://ag.purdue.edu/commercialag/ageconomybarometer/wp-content/uploads/2026/11/AEB-Report-October-2026.pdf
- Jan Willem Erisman, Mark A. Sutton, James Galloway, Zbigniew Klimont and Wilfried Winiwarter, “How a century of ammonia synthesis changed the world,” Nature Geoscience 1, 636-639 (2008). Haber-Bosch nitrogen fed about 48 percent of the world’s population in 2008 and about 44 percent in 2000. Accessed Nov. 20, 2026. https://www.nature.com/articles/ngeo325
- Center for Strategic and International Studies, “Chokepoint: How the War with Iran Threatens Global Food Security,” March 11, 2026. Hormuz supports 20-30 percent of global fertilizer exports, including 35 percent of urea. Accessed Nov. 20, 2026. https://www.csis.org/analysis/chokepoint-how-war-iran-threatens-global-food-security
- StoneX, Josh Linville, “Ammonia and UAN Plants Sold Out for Months Keep Nitrogen Prices Firm,” Nov. 18, 2026. Fertilizer vessels, including urea, moving through Hormuz a few times a week; sulfur and anhydrous ammonia still disrupted. Accessed Nov. 20, 2026. https://www.stonex.com/en-us/insights/ammonia-and-uan-plants-sold-out-for-months-keep-nitrogen-prices-firm/
- Green Markets nitrogen and potash posts, Nov. 13, 2026. NOLA urea $415-$429/st FOB; NOLA potash $340-$347/st; Tampa ammonia $640/mt for November. Accessed Nov. 20, 2026. https://fertilizerpricing.com/nitrogen-posts/ https://fertilizerpricing.com/potash-posts/
- Morgan Downey, Commodity News, fertilizer notes, Nov. 18, 2026, citing Green Markets: NOLA urea down $9/st and about 300,000 metric tons of urea queued to exit Hormuz amid better vessel availability. Also cites DTN’s second-week November retail survey. Accessed Nov. 20, 2026. https://commoditynews.morgandowney.com/news/fertilizers
- CF Industries, “CF Industries, JERA and Mitsui Break Ground on Blue Point One,” Aug. 26, 2026. Construction began August 2026; 1.4 million metric tons a year; production expected 2029. Accessed Nov. 20, 2026. https://www.cfindustries.com/newsroom/2026/blue-point-groundbreaking
- CF Industries, nine months 2026 earnings release, Nov. 4, 2026. Third-quarter net earnings $436 million; nitrogen fundamentals remain constructive into 2027; Blue Point One construction commenced in August 2026. Accessed Nov. 20, 2026. https://ir.cfindustries.com/Investors/news/news-details/2026/CF-Industries-Holdings-Inc–Reports-First-Nine-Months-2026-Net-Earnings-of-1-78-Billion-Adjusted-EBITDA-of-3-01-Billion/default.aspx
- Nutrien, third quarter 2026 results, Nov. 4, 2026. Net earnings $0.29 billion; White Springs shutdown planned for the second quarter of 2027; Aurora retained. Accessed Nov. 20, 2026. https://www.nutrien.com/news/press-releases/nutrien-reports-third-quarter-2026-results-1761
- Yara International, “Yara acquires Gulf Coast Ammonia plant,” July 2, 2026. Nameplate 1.3 million metric tons a year; commissioning, with stable full-capacity operations targeted by the end of 2026; consideration $1.3 billion; subject to customary closing conditions. Accessed Nov. 20, 2026. https://www.yara.com/corporate-releases/yara-acquires-gulf-coast-ammonia-plant/
- Woodside Energy, Beaumont New Ammonia project page. 1.1 million metric tons a year; first production December 2025; operational control March 2026; lower-carbon output targeted for 2027, subject to Linde and ExxonMobil CCS. Accessed Nov. 20, 2026. https://www.woodside.com/what-we-do/growth-projects/beaumont-new-ammonia
- ZAWYA, “Rising costs, equipment delays stall green and low-carbon ammonia FIDs: Fertiglobe CEO,” Anoop Menon, Nov. 8, 2026 (ADIPEC panel, Abu Dhabi); CNBC interview Nov. 13, 2026 (about 30 percent of global urea exports). El-Hoshy said 30 percent of globally traded urea and 47 percent of sulfur flow through the Strait. Accessed Nov. 20, 2026. https://www.zawya.com/en/projects/industry/rising-costs-equipment-delays-stall-green-and-low-carbon-ammonia-fids-fertiglobe-ceo-2126439
- European Commission, CBAM definitive regime, covering imported ammonia, urea and other fertilizers from Jan. 1, 2026. Accessed Nov. 20, 2026. https://taxation-customs.ec.europa.eu/carbon-border-adjustment-mechanism/cbam-definitive-regime_en
- Federal Register, phosphate fertilizers from Morocco, final results of first full sunset review, Nov. 3, 2026. Russian phosphate duties remain in force. Accessed Nov. 20, 2026. https://www.federalregister.gov/documents/2026/11/03/2026-22435/phosphate-fertilizers-from-the-kingdom-of-morocco-final-results-of-first-full-sunset-review-of-the
- UKMTO weekly assessment of Nov. 13, 2026, as reported by Maritime News BD: 139 outbound and 169 inbound Hormuz transits; overall traffic about 65 percent below pre-conflict levels. Accessed Nov. 20, 2026. https://maritimenewsbd.com/gulf-oil-exports-recover-hormuz-traffic-iea-ukmto/
- Energy News Beat, “Diesel’s Winter Tug-of-War: Russian Refining Cuts Pull One Way, a Sliding European Crack the Other,” Nov. 20, 2026.
- World Trade Organization, news item, March 19, 2026. Around one-third of the world’s fertilizer exports normally pass through the Strait of Hormuz. Accessed Nov. 20, 2026. https://www.wto.org/english/news_e/news26_e/stat_19mar26_329_e.htm
- Fertilizer Daily, citing Argus, “China phosphate exports,” Oct. 15, 2026. Trade reports of tightly curbed Chinese phosphate shipments. Accessed Nov. 20, 2026. https://www.fertilizerdaily.com/20261015-china-phosphate-exports-2026-sulfur-argus/
- The White House, presidential action, June 29, 2026, declaration of emergency and authorization for temporary duty-free importation of phosphate fertilizer from Morocco, suspending countervailing duties for up to eight months. Accessed Nov. 20, 2026. https://www.whitehouse.gov/presidential-actions/2026/06/declaration-of-emergency-and-authorization-for-temporary-duty-free-importation-of-phosphate-fertilizer-morocco/
- Congressional Research Service, Insight IN12742, on the June 2026 suspension of countervailing duties on Moroccan phosphate fertilizer. Accessed Nov. 20, 2026. https://www.everycrsreport.com/reports/IN12742.html
- Yara International, third-quarter 2026 report. “Yara expects closing the transaction by the end of 2026.” Accessed Nov. 20, 2026. https://www.yara.com/siteassets/investors/057-reports-and-presentations/quarterly-reports/2026/3q-2026/yara-3q-2026-report.pdf
- Our World in Data, “How many people does synthetic fertilizer feed?” summarizing Erisman et al. 2008 and Smil (2004), including the estimate that global crop harvests would be about half of current levels without nitrogen fertilizer. Accessed Nov. 20, 2026. https://ourworldindata.org/how-many-people-does-synthetic-fertilizer-feed
Appendix B. Key excerpts
Lukas Ekwueme, X, Nov. 19, 2026. “Fertilizer shipments through Hormuz accounted for ~20% of global fertilizer trade… Now they have fallen to zero. Meanwhile, nitrogen fertilizer is responsible for ~50% of global food production. We are losing access to two of the most important ingredients of food production… Diesel and fertilizer. Less fertilizer + less diesel = less food production = higher food prices. Brace for another wave of inflation.”
World Visualized chart on that post, credited to WTO and AXSMarine. Title: “Fertilizer shipments through Hormuz fall to zero.” Subtitle: “Fertilizer shipments through the Strait of Hormuz fall sharply as the closure reaches 235 days.” Annotation: “Shipments declined after March, reaching zero in September and October.” Footnote: AIS-traceable vessels only; daily index base average daily volume in January-March 2025 equals 100. Last month plotted: October 2026.
CNBC, Nov. 20, 2026. “Brent is on track for a 6% decline for the week and the December WTI contract for an 8% weekly drop as expectations of a supply surplus grew because crude shipments through the Strait of Hormuz have returned to roughly pre-war levels.”
Erisman, Sutton, Galloway, Klimont and Winiwarter, Nature Geoscience, 2008. The paper estimates that Haber-Bosch nitrogen fertilizer fed about 48 percent of the world’s population in 2008 and about 44 percent in 2000, often summarized as feeding about half the world.
USGS Mineral Commodity Summaries 2026, nitrogen. Net import reliance as a percentage of apparent consumption was estimated at 5 percent in 2025. Import sources, 2021-24: Canada, 49 percent; Trinidad and Tobago, 47 percent; other, 4 percent.
USGS Mineral Commodity Summaries 2026, potash and phosphate rock. Potash net import reliance was estimated at 92 percent in 2025. Phosphate rock net import reliance was estimated at 16 percent in 2025.
USDA ERS farm sector income forecast, Sept. 3, 2026. “Forecast at $158.4 billion for the calendar year, net farm income would be $4.3 billion (2.6 percent) lower than in 2025 (not adjusted for inflation).” Fertilizer, lime and soil conditioner expenses “are expected to increase in 2026 (by $5.3 billion or 15.3 percent). Fuel and oil expenses are also expected to increase (by $4.8 billion or 28.8 percent).”
Purdue-CME Ag Economy Barometer, October 2026 report. “Farmer sentiment improved in October, with the Purdue University-CME Group Ag Economy Barometer (AEB) Index increasing from 123 points in September to 126 points… High input costs remain the biggest concern.”
Yara, July 2, 2026. “The plant is currently in commissioning and is anticipated to continue ramping up toward full production and stable operations by end of 2026, with production targeted at above nameplate capacity.” Completion was “subject to customary closing conditions, including receipt of relevant regulatory approvals.”
CF Industries earnings release, Nov. 4, 2026. Third quarter 2026 net earnings of $436 million. “Global Nitrogen Supply-Demand Fundamentals Remain Constructive into 2027. Blue Point One Construction Commenced in August 2026.”
Appendix C. Data tables
The tables below collect the figures used in the article. Official series and company announcements are listed with their sources and as-of dates.
Table A. Verdict on the Nov. 19 post’s main claims
| Claim | Verdict | Basis |
| Hormuz accounted for about 20 percent of global fertilizer trade | Supported, at the low end of a range | CSIS 20-30 percent of exports (35 percent of urea); WTO about a third of world fertilizer exports; Fertiglobe 30 percent of urea and 47 percent of sulfur |
| Now they have fallen to zero | Stale as a present-tense claim | WTO-AXSMarine chart in the post is at zero in September and October. Mid-November market reports show urea moving again, with ammonia and sulfur still disrupted. Overall Hormuz traffic still about 65 percent below pre-conflict levels (UKMTO). |
| Nitrogen fertilizer is responsible for about 50 percent of global food production | Needs tighter wording | Erisman et al. 2008: Haber-Bosch nitrogen fed about 48 percent of the world’s population in 2008 (44 percent in 2000). Accurate phrase: “feeds about half the world.” |
| Less fertilizer plus less diesel means higher food prices and another inflation wave | Unproven as a current CPI fact; a risk, not a one-for-one map | October food CPI rose 0.5 percent, food at home 0.4 percent, seasonally adjusted. Food is 13.447 percent of CPI-U. No official October 12-month food change. Urea prices have already retreated from the second-quarter spike. |
The CNBC item published Nov. 20 about pre-war Hormuz flows refers to crude shipments, not fertilizer.
Table B. World Bank fertilizer benchmarks, dollars a metric ton
| Series | 2025 | Q4 2025 | Q1 2026 | Q2 2026 | Q3 2026 | Oct. 2026 |
| Urea, prill, FOB Middle East | 422.7 | 398.7 | 537.7 | 693.5 | 399.2 | 420.0 |
| DAP, spot, FOB U.S. Gulf | 685.2 | 696.6 | 634.7 | 759.5 | 791.8 | 803.1 |
| Potash, granular MOP, CFR Brazil | 347.5 | 354.7 | 373.0 | 402.9 | 383.6 | 357.5 |
Source: World Bank Pink Sheet, November 3, 2026. Urea series is listed as “Urea, E. Europe” and footnoted as prill spot FOB Middle East.
Table C. U.S. net import reliance, 2025 estimates
| Nutrient | Net import reliance | Main import sources, 2021-24 |
| Ammonia (nitrogen content) | About 5 percent | Canada 49 percent; Trinidad and Tobago 47 percent; other 4 percent |
| Phosphate rock | About 16 percent | Peru greater than 99 percent |
| Potash (K2O equivalent) | About 92 percent | Canada 79 percent; Russia 12 percent; Israel 3 percent; other 6 percent |
Source: USGS Mineral Commodity Summaries 2026, published February 2026. Net import reliance is as a percentage of apparent consumption.
Table D. U.S. ammonia projects cited in this article
| Project | Capacity | Status | Source |
| Woodside Beaumont New Ammonia, Texas | 1.1 million metric tons a year | First conventional production December 2025; Woodside operational control March 2026; lower-carbon output targeted 2027, subject to Linde and ExxonMobil CCS | Woodside |
| Gulf Coast Ammonia, Texas City | 1.3 million metric tons a year | In commissioning as of Yara’s July 2, 2026, announcement; stable full-capacity operations targeted by end of 2026; Yara’s third-quarter 2026 report said it expects to close the transaction by the end of 2026; acquisition subject to customary closing conditions | Yara |
| Blue Point One, Louisiana (CF 40 percent, JERA 35 percent, Mitsui 25 percent) | 1.4 million metric tons a year | Construction began August 2026; production expected 2029 | CF Industries, JERA |
Beaumont is producing; Gulf Coast Ammonia is ramping.
Table E. USDA fertilizer cost of production and farm income
| Item | Figure | Source and date |
| 2026 net farm income (forecast) | $158.4 billion, down 2.6 percent from 2025 | ERS, Sept. 3, 2026 |
| 2026 fertilizer, lime and soil conditioners | Up $5.3 billion, or 15.3 percent | ERS, Sept. 3, 2026 |
| 2026 fuel and oil expenses | Up $4.8 billion, or 28.8 percent | ERS, Sept. 3, 2026 |
| 2026 direct government payments | $47.4 billion | ERS, Sept. 3, 2026 |
| Corn fertilizer, 2026F / 2027F | $203.43 / $203.40 per planted acre | ERS cost-of-production forecasts |
| Soybean fertilizer, 2026F / 2027F | $70.04 / $70.03 per planted acre | ERS cost-of-production forecasts |
The income forecast is dated Sept. 3, 2026, and does not fully incorporate later market events.
Table F. October 2026 CPI food weights and monthly changes
| Item | Relative importance, Sep. 2026 | SA one-month change, October 2026 |
| Food | 13.447 percent | 0.5 percent |
| Food at home | 8.162 percent | 0.4 percent |
| Food away from home | 5.285 percent | 0.5 percent |
| All items | 100.000 percent | 0.4 percent |
Source: BLS CPI-U, October 2026, Table 1, released Nov. 10, 2026. Most 12-month changes, including food, were not published because October 2025 indexes are missing after the 2025 lapse in appropriations.