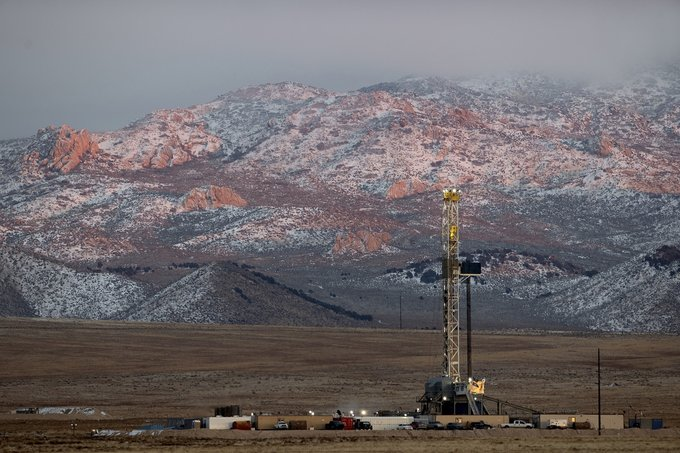
U.S. drilling activity remains firmly elevated on a year-over-year basis even as weekly moves stay modest. Baker Hughes’ traditional rotary count printed 604 active U.S. rigs for the week ending November 6, 2026 (up 1 week-over-week and up 56 from a year earlier). Oil-directed rigs reached 463 (+1) and gas-directed rigs 131 (+1). WellDatabase’s operator-level U.S. Rig Report dated 11.7.2026 showed 607 total rigs (down 2 on the week, up 55 year-over-year), with oil at 436 (+2 WoW, +50 YoY) and gas at 127 (+1, essentially flat YoY). Enverus’ GPS-tracked Daily Rig Count, which captures a broader active fleet in near-real time, has continued to run higher—last public snapshots in late October hovered near 645 after a roughly 3% weekly dip, with earlier October readings in the mid-650s to low-660s.PetroeyesOilandgas360
The three sources use different methodologies and therefore produce different absolute numbers while describing the same underlying trend: solid year-over-year growth concentrated in oil-weighted basins, modest weekly volatility, and continued dominance by the Permian. Baker Hughes remains the market’s standard weekly rotary census (land, inland waters, and offshore). WellDatabase cross-references that census with permits and operator detail for granular state, basin, well-type, wellbore, and depth breakdowns. Enverus tracks a larger share of the fleet daily via GPS, which structurally produces a higher headline count.Energynewsbeat
State and Basin Comparison
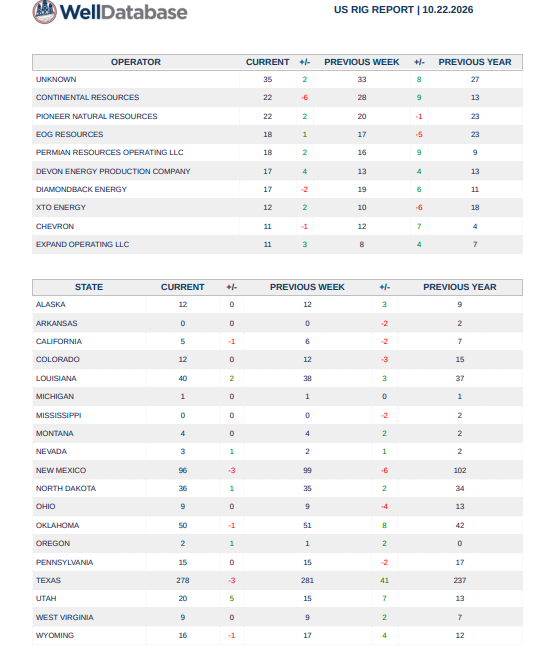
Baker Hughes and WellDatabase align closely on the major states and basins this week:
- Texas: 277 rigs (WellDatabase +2; Baker Hughes reports also show Texas near 277).
- New Mexico: 101 (WellDatabase +2).
- Oklahoma: 50 (flat).
- Louisiana: 38 (WellDatabase –3).
- North Dakota: WellDatabase 34 (–4); Baker Hughes Williston around 35 (–1).
Key basins (WellDatabase / Baker Hughes):
- Permian: 273 (+1 both sources, +22 year-over-year). Still by far the largest, accounting for roughly 45% of U.S. activity.
- Haynesville: 56 (+1, +15 YoY)—the clearest gas-growth area.
- Eagle Ford: 50 (flat).
- Williston: 38 on WellDatabase (–4) / ~35 on Baker Hughes (–1).
- Granite Wash: 23 (+1).
- Marcellus: 23 (flat).
- Cana Woodford: 18 (flat).
- Other / residual categories remain sizable on both tapes.
WellDatabase’s top operators this week include Unknown (36), Devon Energy (21), Continental Resources (19), Diamondback Energy (19), EOG Resources (17), and Pioneer Natural Resources (17). Horizontal wells dominate at 503 (+3), with oil wells at 436. Depth distribution continues to favor the 10k–15k ft and deeper categories.
Enverus public basin snapshots from late October showed the Permian in the mid-240s on some daily reads (with “Other” capturing a large residual), Williston near the mid-30s, and strength in Anadarko/Gulf Coast areas—consistent with the higher overall total driven by private operators and broader fleet coverage. Private operators have accounted for the bulk of recent rig additions in Enverus analyses.Energynewsbeat
SPR, Distillate Inventories, and Cushing
The Strategic Petroleum Reserve has fallen to multi-decade lows. EIA data show the SPR at 282.2 million barrels for the week ending October 30, 2026—down roughly 133 million barrels from the February 2026 peak of 415.4 million and the lowest level since the early 1980s fill period. The drawdown accelerated after early 2026 geopolitical disruptions affecting the Strait of Hormuz; much of the release has been structured as exchanges/loans rather than permanent sales, with repayment expected over subsequent years. Authorized capacity remains ~714 million barrels, so the reserve is roughly 40% full.Eco3min
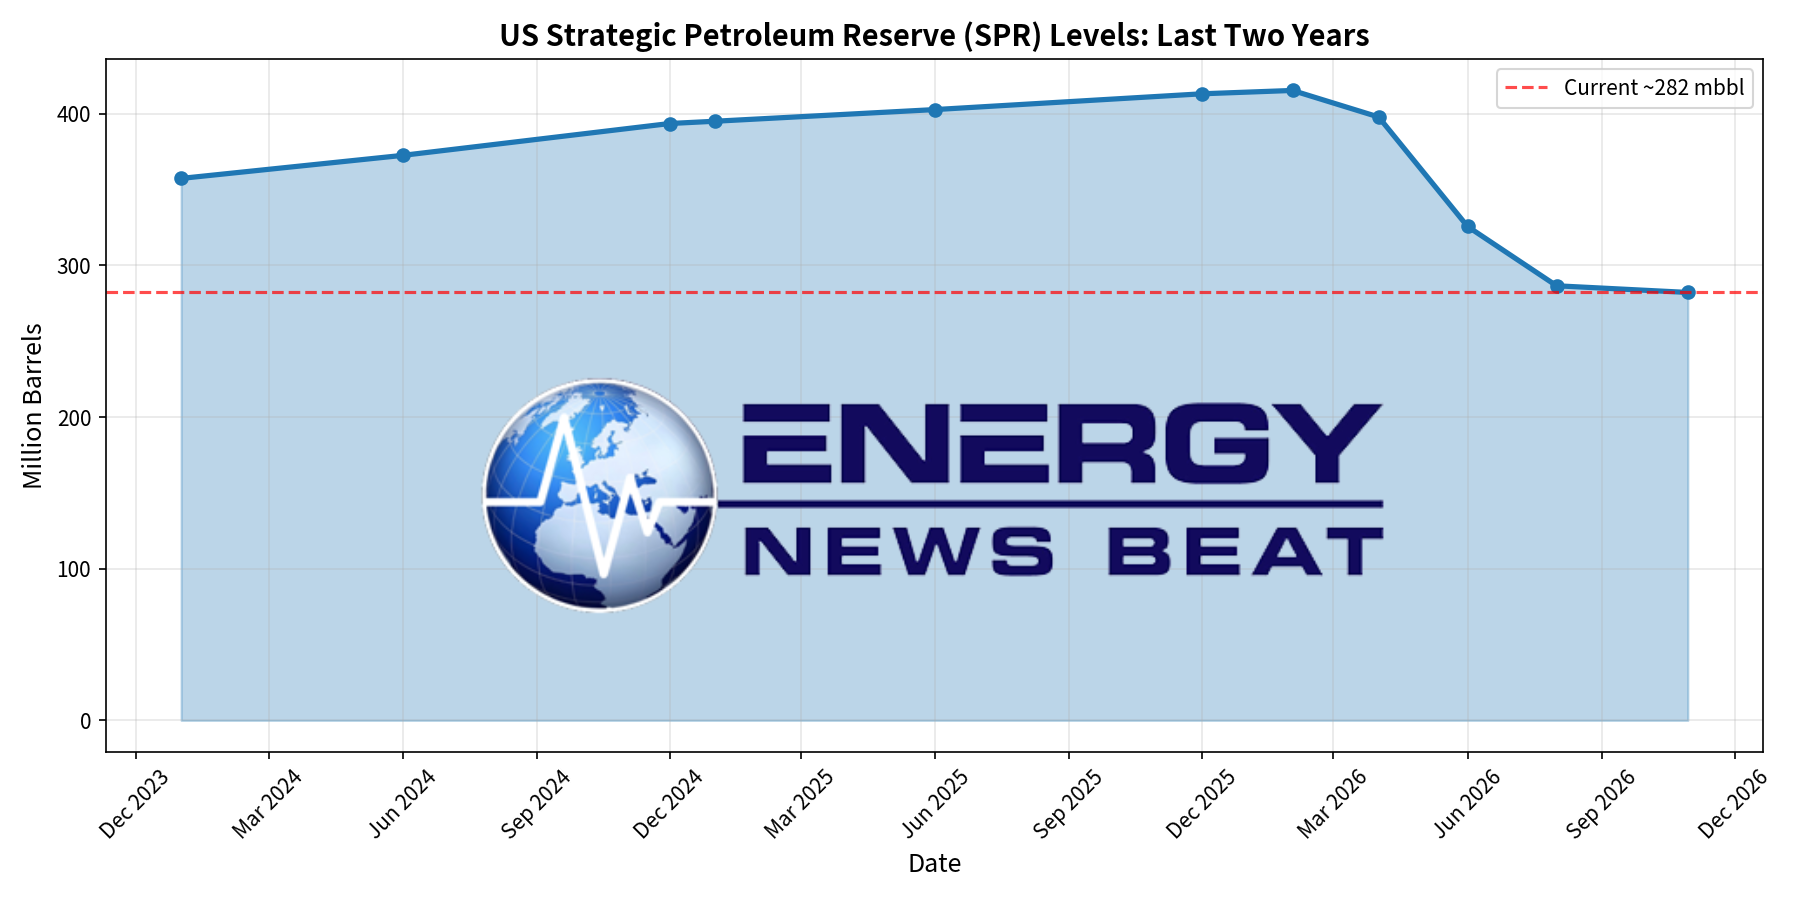
Approximate SPR trajectory (million barrels, EIA):
- End-2024: ~394
- End-2025: ~413
- February 2026 peak: 415.4
- October 30, 2026: 282.2
Commercial crude stocks (excluding SPR) stood near 409.8 million barrels (week ending October 30), roughly 4% below the five-year average after several consecutive draws.
Cushing, Oklahoma (the WTI delivery point) held 27.3 million barrels (up ~0.3 million on the week). This is a recovery from summer lows near 18–21 million but still modest relative to historical capacity (~76 million working) and not signaling extreme tightness at the hub itself.Storagecurve
Distillate inventories (diesel and heating oil) are tight: 99.3 million barrels (down 3.6 million on the week), about 13% below the five-year seasonal average and near the low end of the historical range for this time of year. Days of supply have fallen to roughly 23.8. Refinery utilization was high at 94.5%.Globaloilshock
Outlook for Consumers and Investors
For consumers, the combination of multi-decade-low SPR levels, tight distillates, and ongoing geopolitical risk premium supports elevated diesel and heating-oil prices heading into winter. High refinery runs help, but low product stocks leave little buffer against weather or export demand.
For investors, the rig picture is constructive for upstream and oilfield-services names. Year-over-year gains of 50+ rigs, Permian and Haynesville leadership, and continued oil-directed strength point to stable-to-rising U.S. production even as efficiency gains keep the absolute count far below prior peaks. Service companies with exposure to horizontal drilling, longer laterals, and private-operator activity stand to benefit. Inventory tightness (especially SPR and distillates) plus residual Middle East risk provide a floor under crude prices, supporting cash flows and returns for producers while the higher Enverus count confirms a broader working fleet than the traditional weekly census alone suggests.
Risks include any sharp drop in oil prices that curbs private-operator activity, further SPR exchange returns that add supply later, or a sudden easing of geopolitical constraints. Overall, the three-source view shows a market that is neither booming nor collapsing—firmly higher than a year ago, modestly volatile week to week, and set against historically tight strategic and product inventories.
We highly recommend WellDatbase.com for your subscription value.
Appendix: Sources and Links
- WellDatabase U.S. Rig Report dated 11.7.2026 (attached document): 607 total rigs (–2 WoW, +55 YoY); detailed state, operator, well-type, wellbore, depth, and basin tables.
- Baker Hughes U.S. Rig Count, week ending November 6, 2026: 604 total (+1 WoW, +56 YoY); oil 463, gas 131. Official overview: https://bakerhughesrigcount.gcs-web.com/rig-count-overview/. Reporting: https://www.oilandgas360.com/baker-hughes-rig-count-11-6/, https://petroeyes.com/rig-counts/, https://rbnenergy.com/daily-posts/analyst-insight/us-rig-count-edges-one-604-haynesville-leads-gulf-mexico-slips.
- Enverus Daily Rig Count (public dashboard): ~645 as of late October 2026 (prior mid-October readings near 658). https://app.drillinginfo.com/drc/ and https://www.enverus.com/dailyrigcount/. Related commentary on private operators: https://www.enverus.com/blog/rig-count-doesnt-tell-you-whats-coming/.
- EIA Weekly Petroleum Status Report (SPR, commercial crude, Cushing, distillates): https://www.eia.gov/petroleum/supply/weekly/. Key series: WCSSTUS1 (SPR), WCESTUS1 (commercial crude), Cushing stocks, WDISTUS1 (distillates). Supporting trackers: https://energyfactbook.com/strategic-petroleum-reserve/, https://www.oilpriceapi.com/data/inventory/spr, https://globaloilshock.com/en/data/us-oil-inventories/.
- Cushing inventories: EIA and https://okenergytoday.com/2026/11/cushing-records-slight-increase-in-crude-oil-inventory/, https://storagecurve.com/crude-oil/us/cushing-inventories/.
- Prior Energy News Beat three-source comparisons: https://energynewsbeat.co/tag/welldatabase/.
All figures are as reported by the respective sources for the periods noted; minor discrepancies reflect methodological differences.