

Bloom Energy sells on-site fuel-cell power plants to data centers, utilities, and businesses, and markets them as “clean energy.” ENB checked the company’s filings, product specs, and deals against federal data. Bloom’s sales and profits rose sharply in the first half of 2026, and as of the Oct. 21, 2026 close, its stock was up more than tenfold in five years. But on natural gas, which fuels most of its fleet, a Bloom server emits about as much CO2 per megawatt-hour as the average U.S. grid. It is cleaner than the gas turbines and engines it often replaces, not zero-carbon.
| Report field | Detail |
| Prepared by | Energy News Beat Research Desk |
| Subject | Bloom Energy Corporation (NYSE: BE), San Jose, Calif. (bloomenergy.com) |
| Latest results reviewed | Q2 2026 (quarter ended June 30, 2026; reported July 28, 2026). Q3 2026 results are not out yet. Bloom says it will report them after the market closes on Oct. 22, 2026, with a conference call at 2 p.m. PT / 5 p.m. ET (4 p.m. CT) (Bloom). Check this report against those numbers. |
| Data as of | Stock data: close of Oct. 21, 2026 (3:00 p.m. CT). Filings: through the Q2 2026 Form 10-Q/A (July 29, 2026). All web sources accessed Oct. 21, 2026. |
| Claim tags | [BLOOM SAYS] = what Bloom says in filings, releases or specs. [ENB ANALYSIS] = ENB calculation or comparison with outside data. [OUTSIDE CLAIM] = a claim by an outside party (short sellers, press, analysts) that ENB has not independently confirmed. [STU’S OPINION] = Stu Turley’s opinion, used only in Stu’s Take. |
| Not investment advice | This report is for information only. It is not a recommendation to buy, sell or hold any security. See the disclaimer at the end. |
1. Bottom line
| The short version
Bottom line (ENB analysis). Bloom Energy has a commercial product and paying customers, and its sales rose sharply in the first half of 2026. Q2 2026 revenue was $1.07 billion, up 166% from a year earlier, with a GAAP operating profit of $182 million (Q2 release). Bloom raised its 2026 revenue outlook to $3.9–4.2 billion (Q2 release). Big names are signing up: Oracle (up to 2.8 GW), AEP (a ~$4 billion, 702 MW project serving Google) and Brookfield (up to $5 billion of financing). On “clean energy,” a fair description is “lower-carbon natural gas power with very little smog-forming pollution.” Bloom’s own filings say “most Energy Server deployments use natural gas” and that the systems vent CO2 (2025 10-K). Bloom’s spec sheet puts emissions at 679–833 lb CO2/MWh (datasheet). The U.S. grid average is 767 (EPA eGRID). That is about 5% to 23% below the U.S. combined-cycle gas fleet (2025 tested full-load heat rate) and 35–47% below simple-cycle turbines (ENB calculation). Its NOx is near zero. It becomes clean energy only on biogas or hydrogen, or with carbon capture, and Bloom has not said what share of its fleet runs on those fuels since 2018 (then about 9% biogas, per its IPO prospectus). The investment case rests on a few customers, rich valuation and fleet performance. Related parties tied to Brookfield made up about 74% of Q4 2025 revenue (ENB calculation from the 2025 10-K and 2025 10-Qs), and one customer made up 73% of Q2 2026 revenue (10-Q/A). At the Oct. 21, 2026 close of $238.53, the stock traded at about 22.6x sales and 116x adjusted EBITDA for the four quarters through Q2 2026 (ENB calculation). Accrued warranty rose from $20.0 million to $77.8 million in six months, mostly a $58.3 million specific reserve, and Bloom attributes $4.6 million of first-half guarantee costs to “fleet degradation” (Q2 10-Q). Bloom has a 2019 accounting restatement and two short-seller attacks (2019 and 2026) in its history. |
Headline findings
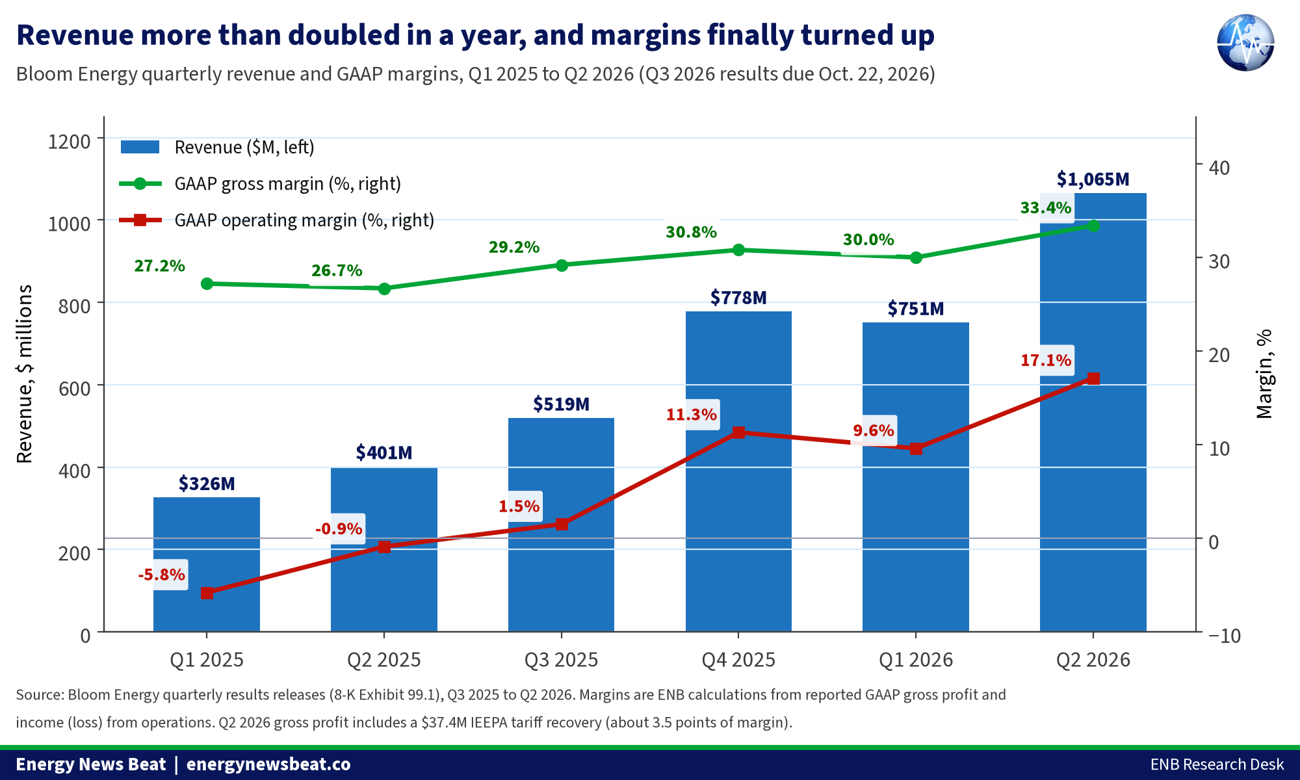
- [BLOOM SAYS] Fast growth in 2026. Q2 2026 revenue was $1,065.4 million (+165.5%), GAAP gross margin 4%, GAAP operating income $182.2 million and GAAP diluted EPS $0.62 (Q2 release). [ENB ANALYSIS] For the four quarters through Q2 2026, revenue was $3,113 million and free cash flow $625 million (ENB calculation). For full-year 2025, Bloom still lost $88.4 million under GAAP (Q4 release).
- [ENB ANALYSIS] One-time help in Q2 2026. Q2 product gross profit included a $37.4 million tariff recovery (Q2 10-Q). Without it, the Q2 GAAP gross margin would have been about 9% instead of 33.4% (ENB calculation).
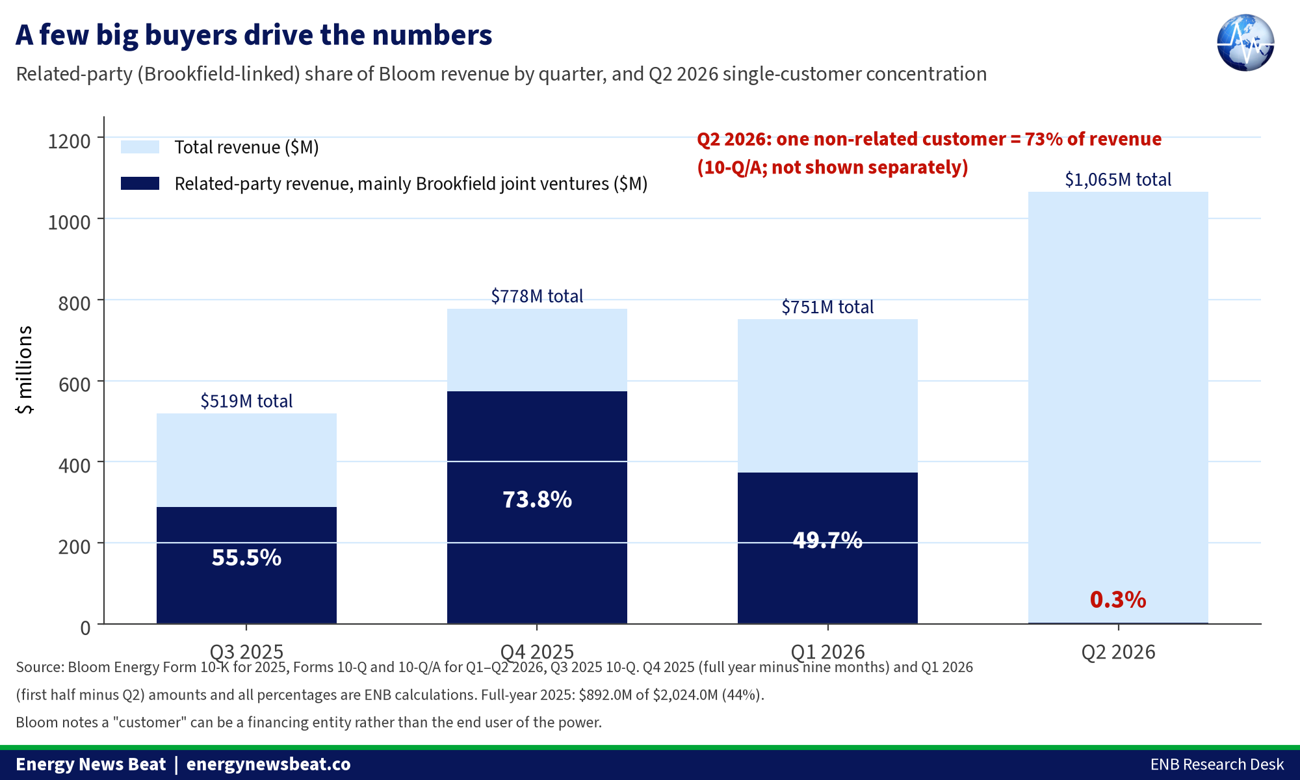
- [BLOOM SAYS] Customer concentration. Brookfield-linked joint ventures (related parties) bought $892.0 million of 2025’s $2,024.0 million revenue (44%) (2025 10-K). [ENB ANALYSIS] That includes about $574.2 million of Bloom’s $777.7 million Q4 2025 revenue (74%; ENB calculation from the 2025 10-K and 2025 10-Qs). [BLOOM SAYS] In Q2 2026, a single unrelated customer made up 73% of revenue (10-Q/A).
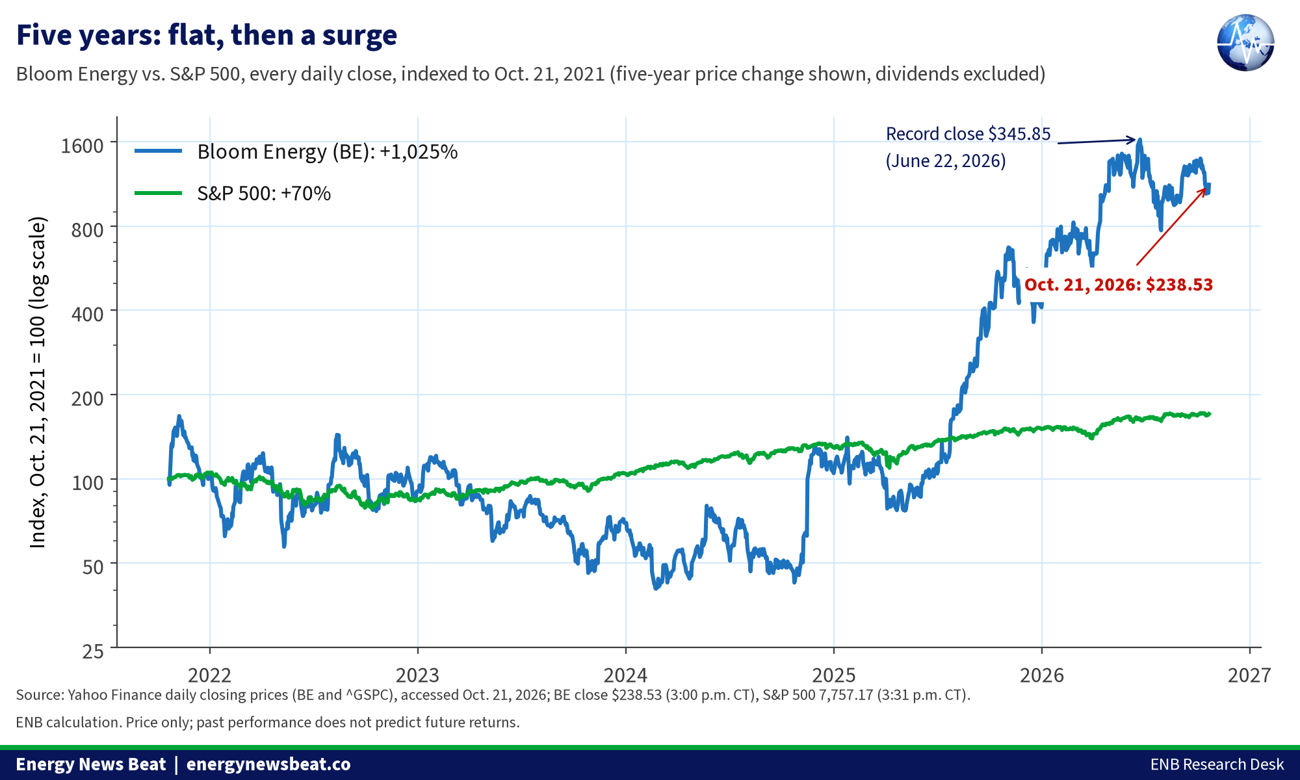
- [ENB ANALYSIS] At $238.53 (Oct. 21, 2026 close) Bloom is worth about $70.3 billion. That is 22.6x sales for the four quarters through Q2 2026, 17.4x the midpoint of 2026 revenue guidance and 88x the midpoint of 2026 non-GAAP EPS guidance. The stock is up 174.5% in 2026 and 1,025% in five years, versus 13.3% and 70.5% for the S&P 500, and, as of the Oct. 21 close, was 31.0% below its June 22 record close (Yahoo Finance).
- [ENB ANALYSIS] The clean-energy test. On natural gas, Bloom’s spec range of 679–833 lb CO2/MWh (datasheet) runs from 11% below to 9% above the U.S. grid average of 767 (eGRID2023). It is about 5–23% below the U.S. combined-cycle fleet (~881, from EIA’s 2025 tested full-load heat rate) and roughly equal to a new best-in-class combined-cycle plant (~757–766, from Lazard heat rates). [BLOOM SAYS] Bloom reported 94 million tonnes of Scope 1 CO2e from its products in 2025 (Impact Report).
- [BLOOM SAYS] Tax credit restored, no emissions test. The July 2025 tax law gives fuel cells a 30% investment tax credit for projects that begin construction after Dec. 31, 2025. In Bloom’s words, that is “regardless of the level of emissions from the fuel cell property” (2025 10-K). [ENB ANALYSIS] The statute does this by switching off, for fuel cells, the zero-emissions requirement and the emissions-recapture rule that apply to other technologies (26 U.S.C. §48E(j)). [BLOOM SAYS] Under the 2022 law, natural-gas fuel cells had lost the credit after 2024 (2025 10-K).
- [ENB ANALYSIS] Warranty and guarantee costs are rising. Accrued warranty rose from $20.0 million (Dec. 31, 2025) to $77.8 million (June 30, 2026), mostly a $58.3 million specific reserve, and Bloom attributes $4.6 million of first-half guarantee costs to “fleet degradation” (Q2 10-Q). [BLOOM SAYS] Bloom paid $13.8 million in performance-guarantee payments in the first half of 2026 and could owe up to $468.9 million more under its guarantees, which it caps (Q2 10-Q). [OUTSIDE CLAIM] Short seller Hunterbrook alleges, from state and federal data, that many Bloom systems fall below their efficiency guarantees within about two years (Hunterbrook).
- [OUTSIDE CLAIM] A big project has hit permit trouble. Oracle’s 2.45 GW Project Jupiter microgrid in New Mexico, planned around Bloom fuel cells (Oracle), is fighting challenges to its air permit. Oracle sent a force majeure notice on Sept. 24 (ENR) and on Oct. 15 said it would cut permitted emissions about 35% (Oracle). A hearing on New Energy Economy’s motion to dismiss the permit application is set for Oct. 26 (Albuquerque Journal). NMED’s Nov. 23 decision deadline may be extended.
2. How it works
[BLOOM SAYS] A Bloom Energy Server is a cabinet-sized power plant built from solid oxide fuel cells. Each cell is a thin ceramic layer between two electrodes, run at high temperature. Fuel, usually natural gas, is reformed inside the system into hydrogen and carbon monoxide. Oxygen from the air passes through the ceramic as ions and reacts with that fuel on the other side, making electricity without a flame. Bloom stresses that “there is no combustion” (2025 10-K). The by-products are heat, water vapor and, when the fuel is natural gas or biogas, carbon dioxide: “During normal operations using natural gas or biogas-fuel sources, the Energy Server system vents carbon dioxide (“CO2”) into the atmosphere as a byproduct” (2025 10-K).
[BLOOM SAYS] Cells are stacked, stacks are grouped into power modules, and modules sit in a server rated at about 325 kW for the current ES 6.5 model (datasheet). Modules can be swapped while the system runs (2025 10-K). Servers are grouped side by side for larger sites. Bloom says its systems run on “natural gas, biogas, and hydrogen” (Impact Report).
2.1 Key specs (Bloom Energy Server 6.5, February 2026 datasheet)
| Spec | Bloom figure | What it means (ENB) |
| Rated output | 325 kW per server | About 3,100 servers per gigawatt (ENB calculation) |
| Electrical efficiency (LHV) | 65% to 53% (“cumulative”) | About 58.7% to 47.9% on the higher-heating-value basis U.S. utilities use (ENB calculation) |
| Heat rate (HHV) | 5,811–7,127 Btu/kWh | U.S. combined-cycle fleet tested average: 7,535 in 2025 (EIA) |
| CO2 on natural gas | 679–833 lb/MWh | U.S. grid average 767 lb/MWh (eGRID2023) |
| NOx | 0.003 lb/MWh | U.S. grid average 0.452 lb/MWh (eGRID2023) |
| Water | None in normal operation | A genuine advantage where water is scarce |
| Weight | 28,745 lb per server | Heavy, but factory-built and trucked in |
Sources: Bloom ES 6.5 datasheet, Feb. 2026; EPA eGRID2023; EIA Electric Power Annual Table 8.2. The efficiency range is what Bloom publishes; Bloom’s Impact Report notes, “As our fuel cells age, efficiency decreases, and replacements are made” (Impact Report).
2.2 How Bloom sells it
[BLOOM SAYS] Customers can buy servers outright, or use them through a power purchase agreement (paying per kilowatt-hour), a capacity agreement or a lease, often with a third-party financier owning the equipment (2025 10-K). Bloom also sells long-term service contracts that cover maintenance and the periodic replacement of power modules, and it gives efficiency and output guarantees. That service book is where fleet performance shows up in the financial statements (section 4.4).
3. Who’s behind it
3.1 Management and board
- [BLOOM SAYS] KR Sridhar, founder, chairman and CEO. Bloom dates its “inception” to 2001 (2025 10-K). He beneficially owned 5,662,140 shares (0%), including options, as of Feb. 27, 2026 (2026 proxy). On June 15, 2026 the board granted him a performance award with a target of 271,076 shares. The filing says Bloom’s market value rose from about $5 billion at the end of 2024 to about $79 billion by June 15, 2026 (8-K).
- [BLOOM SAYS] Simon Edwards, CFO since April 13, 2026, who joined from Groq, Inc., “an artificial intelligence company,” where he was CEO from December 2025 to March 2026 (8-K). He replaced Daniel Berenbaum. Maciej Kurzymski is principal accounting officer. Other executives named in the proxy include Aman Joshi (chief commercial officer) and Shawn Soderberg (chief legal officer) (2026 proxy).
- [BLOOM SAYS] The board includes former Cisco CEO John Chambers and former GE CEO Jeffrey Immelt (2026 proxy). Directors and executive officers as a group owned 0% as of Feb. 27, 2026. [OUTSIDE CLAIM] Third-party market reports say Chambers sold 15,000 shares at $250 in August 2026 and Immelt 30,000 shares at about $238.91. ENB did not open the underlying Form 4s.
3.2 Major shareholders
| Holder | Stake | As of / source |
| Ameriprise Financial (Columbia Threadneedle) | 6.4% | June 30, 2026; Schedule 13G/A |
| BlackRock | 6.0% | June 30, 2026; Schedule 13G/A |
| The Vanguard Group | 6.9% (19.5 million shares) | Dec. 29, 2023 filing, as listed in the 2026 proxy; stale |
| Jane Street Group | 5.1% | July 29, 2026; Schedule 13G. Trading firm; stake may include hedges |
| KR Sridhar | 2.0% | Feb. 27, 2026; 2026 proxy |
| SK ecoplant and Econovation (voting agreements) | about 2.5% covered | Record date 2026; 2026 proxy |
[BLOOM SAYS] Oracle also became a shareholder. Under an October 2025 deal Bloom granted Oracle a warrant for 3,531,073 shares at $113.28. Oracle exercised it cashless on May 1, 2026 and received 1,905,433 shares plus 248,798 inducement shares. Bloom values the total consideration at $324.4 million and books it as a reduction of revenue over time (8-K; Q2 10-Q).
3.3 Funding and partners
- [BLOOM SAYS] Public markets. Bloom went public in July 2018 at $15 a share (IPO prospectus). It had an accumulated deficit of $3.72 billion at June 30, 2026 (Q2 10-Q), the running total of its losses since its founding.
- [BLOOM SAYS] Convertible debt. In November 2025 Bloom sold $2.5 billion of 0% convertible senior notes due Nov. 15, 2030, convertible at about $194.97 a share (up to 55 million shares) (8-K; Q2 10-Q). It also has a $600 million revolving credit line (Dec. 19, 2025), undrawn apart from $90 million of letters of credit (8-K; Q2 10-Q).
- [BLOOM SAYS] In October 2025 Brookfield agreed to invest up to $5 billion to deploy Bloom fuel cells, with Bloom as its preferred on-site power provider (Bloom/Brookfield). Bloom owns 9.9–15.0% stakes in Brookfield-led project companies that buy its systems. Its maximum exposure to them was $68.8 million at June 30, 2026 (Q2 10-Q).
- [BLOOM SAYS] SK ecoplant (South Korea). Bloom’s Korean partner since 2018. Korea is Bloom’s largest market outside the U.S., at nearly 682 MW deployed (2025 10-K).
4. Earnings: what the filings show
[BLOOM SAYS] As of Oct. 21, 2026, Bloom’s latest reported quarter is Q2 2026. Q3 2026 results are due after the market closes on Oct. 22, 2026 (Bloom); this report does not include them.
4.1 Latest quarter: Q2 2026
| $ millions unless noted | Q2 2026 | Q1 2026 | Q2 2025 | Change vs. Q2 2025 |
| Revenue | 1,065.4 | 751.1 | 401.2 | +165.5% |
| Product revenue | 935.4 | 653.3 | 296.6 | +215.4% |
| GAAP gross margin | 33.4% | 30.0% | 26.7% | +6.7 pts |
| Non-GAAP gross margin | 34.3% | 31.5% | 28.2% | +6.0 pts |
| GAAP operating income (margin) | 182.2 (17.1%) | 72.2 (9.6%) | (3.5) (−0.9%) | +185.7 |
| Non-GAAP operating income (margin) | 239.6 (22.5%) | 129.7 (17.3%) | 28.6 (7.1%) | +211.0 |
| Adjusted EBITDA | 253.4 | 143.0 | 41.2 | +212.1 |
| Net income (loss) to common | 196.3 | 70.7 | (42.6) | n/m |
| GAAP diluted EPS | $0.62 | $0.23 | $(0.18) | +$0.80 |
| Non-GAAP diluted EPS | $0.78 | $0.44 | $0.10 | +$0.68 |
| Operating cash flow | 226.4 | 73.6 | (213.1) | +439.5 |
| Capital spending | (51.6) | (26.2) | (7.2) | |
| Free cash flow (ENB calc.) | 174.8 | 47.4 | (220.4) |
Source: Q2 2026 results release and Q1 2026 release (8-K Exhibit 99.1). Product revenue for Q1 2026 and Q2 2025 is ENB arithmetic from the releases’ revenue lines. Free cash flow = operating cash flow − purchases of property, plant and equipment (ENB). Non-GAAP figures exclude stock-based compensation ($56.4 million at the operating
4.2 Full year 2025 vs. 2024
| $ millions unless noted | 2025 | 2024 | Change |
| Revenue | 2,024.0 | 1,473.9 | +37.3% |
| GAAP gross margin | 29.0% | 27.5% | +1.6 pts |
| Non-GAAP gross margin | 30.3% | 28.7% | +1.6 pts |
| GAAP operating income (margin) | 72.8 (3.6%) | 22.9 (1.6%) | +49.9 |
| Non-GAAP operating income (margin) | 221.0 (10.9%) | 107.6 (7.3%) | +113.4 |
| Net loss to common | (88.4) | (29.2) | wider loss |
| GAAP EPS | $(0.37) | $(0.13) | |
| Non-GAAP EPS (diluted) | $0.76 | $0.28 | |
| Adjusted EBITDA | 271.6 | 160.7 | +69% |
| Operating cash flow | 113.9 | 92.0 | |
| Free cash flow (ENB calc.) | 57.2 | 33.1 |
Source: Q4 2025 results release, Feb. 5, 2026, and 2025 Form 10-K. The 2025 net loss includes a $66.2 million debt-conversion inducement expense in Q4 2025 (Q1 2026 release). GAAP operating margins are ENB calculations.
[ENB ANALYSIS] Bloom’s GAAP profit record before 2026 is thin. It lost money under GAAP in 2024 and 2025 and had an accumulated deficit of $3.72 billion at June 30, 2026 (Q2 10-Q). Among the periods ENB reviewed (2024 through Q2 2026), Q1 and Q2 2026 are the first back-to-back quarters of large GAAP profits. GAAP net income to common for the four quarters through Q2 2026 is about $245 million (ENB calculation).
4.3 Guidance
| 2026 guidance | Feb. 5, 2026 | July 28, 2026 (raised) |
| Revenue | $3.1–3.3 billion | $3.9–4.2 billion |
| Non-GAAP gross margin | ~32% | ~34% |
| Non-GAAP operating income | $425–475 million | $800–900 million |
| Non-GAAP EPS | $1.33–1.48 | $2.55–2.85 |
Source: Q4 2025 release; Q2 2026 release. [ENB ANALYSIS] The first half of 2026 delivered $1,816.4 million of revenue, so the range given on July 28, 2026 implies $2.08–2.38 billion in the second half, or about $1.04–1.19 billion a quarter (ENB calculation). At year-end 2025 Bloom reported total backlog of about $20 billion, of which product backlog was about $6 billion (Q4 2025 release).
4.4 Quality of earnings: what to look under
- [BLOOM SAYS] Tariff refund. Q2 product gross profit included a $37.4 million recovery of tariffs paid under the International Emergency Economic Powers Act (Q2 10-Q). [ENB ANALYSIS] That is about 5 points of Q2 gross margin. It should not repeat.
- [BLOOM SAYS] Warranty and guarantees. Accrued warranty rose to $77.8 million at June 30, 2026 from $20.0 million at Dec. 31, 2025, most of the increase being a specific reserve of $58.3 million (Q2 10-Q). The 10-Q says service costs reflected “higher product performance guarantee costs of $3.0 million and $4.6 million” for the three and six months, “reflecting the effects of fleet degradation”; that is the only place the 10-Q uses the phrase. Bloom paid $5.4 million of performance guarantees in Q2 and $13.8 million in the first half. Its guarantee payments are capped at $846.1 million, with $468.9 million of potential exposure remaining (Q2 10-Q).
- [ENB ANALYSIS] Service business. Bloom’s service segment (maintenance and module replacement) went from a -0.7% gross margin in 2024 to 0% in 2025 and 18.7% in Q2 2026 (Q4 2025 release; Q2 release). That is real improvement, but service is still a low-margin business for Bloom, and it carries the cost of aging fuel cells.
- [BLOOM SAYS] Who the customer is. H1 2026: two customers made up 44% and 21% of revenue, the second a related party. Q2 2026: one unrelated customer made up 73% (10-Q/A). Bloom filed the 10-Q/A on July 29, 2026 to correct a mix-up between the three-month and six-month columns in these disclosures. In Bloom’s accounting, a “customer” can be a financing entity that owns the systems rather than the company using the power (2025 10-K).
- [BLOOM SAYS] Related parties. Revenue from related parties, mainly Brookfield-led joint ventures in which Bloom holds 9.9–15.0%, was $288.0 million in Q3 2025, $574.2 million in Q4 2025, $373.3 million in Q1 2026 and $2.8 million in Q2 2026 (Q3 2025 10-Q; 2025 10-K; Q2 10-Q). [ENB ANALYSIS] The Q4 2025 figure is ENB’s derivation (full-year $892.0 million minus the first nine months), and Q1 2026 is the first-half total ($376.1 million) minus Q2.
[BLOOM SAYS] Oracle warrant. The $324.4 million value of the warrant and inducement shares given to Oracle is booked as a customer-consideration asset and amortized as a reduction of revenue; $17.9 million had been amortized by June 30, 2026 (Q2 10-Q
4.5 Balance sheet and debt (June 30, 2026)
| Item | Amount | Terms |
| Cash and equivalents | $2,666.9 million | Plus about $21.6 million restricted cash |
| 0% Convertible Senior Notes due 2030 | $2,500.0 million | Matures Nov. 15, 2030; conversion price about $194.97; up to 19.55 million shares; Bloom may redeem from Nov. 20, 2028 |
| 3.0% Green Convertible Notes due 2029 | $27.0 million | Conversion price about $20.84 |
| 3.0% Green Convertible Notes due 2028 | $0.8 million | Conversion price about $18.85 |
| Korean JV term loan | $2.6 million | 4.6%; due Oct. 2026 |
| Total debt principal | $2,530.3 million | Recourse carrying value $2,475.4 million |
| Revolving credit facility | $600 million | Undrawn; $90 million letter-of-credit sub-limit fully used, leaving about $510 million |
| Shareholders’ equity | $1,640.7 million | Accumulated deficit $(3,721.0) million |
| Shares outstanding | 294.5 million | July 22, 2026 |
Source: Q2 2026 Form 10-Q; 8-K on the 2030 notes; 8-K on the credit agreement. [ENB ANALYSIS] Cash slightly exceeds debt, so net debt is about −$0.16 billion (net cash). At the Oct. 21, 2026 close of $238.53, the 2030 notes were “in the money”: if converted, they would add up to about 6.6% more shares (19.55 million ÷ 294.5 million; ENB calculation), unless Bloom settles in cash.
5. Stock and valuation
5.1 Price and performance
| Measure | Bloom (BE) | S&P 500 |
| Close, Oct. 21, 2026 | $238.53 (3:00 p.m. CT; +7.1% on the day) | 7,757.17 (3:31 p.m. CT) |
| Year to date (from $86.89 on Dec. 31, 2025) | +174.5% | +13.3% |
| 1 year (from $104.38) | +128.5% | +15.2% |
| 3 years (from $11.31) | +2,009% | +83.6% |
| 5 years (from $21.20) | +1,025% | +70.5% |
| 52-week range | $75.70–$351.28 (intraday) | |
| Record close | $345.85 (June 22, 2026); -31.0% as of Oct. 21 close |
Source: Yahoo Finance daily closes for BE and the S&P 500, accessed Oct. 21, 2026. Price returns only, no dividends (Bloom pays none). Base dates are the last close on or before each anniversary. Returns are ENB calculations.
5.2 Valuation
| Multiple | Value | Basis (ENB calculation) |
| Market value | $70.3 billion | $238.53 × 294.5 million shares |
| Enterprise value | $70.1 billion | Market value + $2.53B debt − $2.69B cash and restricted cash |
| Price / sales, 4 quarters through Q2 2026 | 22.6x | Trailing revenue $3,113M (Q3 2025–Q2 2026) |
| Price / 2026 sales guidance | 17.4x | Midpoint $4.05 billion |
| EV / adj. EBITDA, 4 quarters through Q2 2026 | 116x | Trailing adj. EBITDA $602M |
| Price / GAAP earnings, 4 quarters through Q2 2026 | ~287x | Trailing net income to common ~$245M |
| Price / 2026 non-GAAP EPS guidance | ~88x | Midpoint $2.70 |
[ENB ANALYSIS] These multiples are high relative to Bloom’s current earnings, which implies investors expect fast growth to continue for years. They use the Oct. 21, 2026 close and results through Q2 2026, and will change when Q3 results come out.
5.3 What analysts say
[OUTSIDE CLAIM] Analyst ratings are collected by data aggregators; ENB did not confirm them with each broker. As of Oct. 21, 2026, StockAnalysis (S&P Global data) listed 29 analysts with a consensus “Buy,” an average price target of $285.43, a median of $303, a low of $97 and a high of $380. Its October count was 10 Strong Buy, 5 Buy, 12 Hold, 1 Sell and 1 Strong Sell. MarketBeat listed 26 analysts, a “Moderate Buy” consensus and an average target of $261.55 (range $39–$351). Recent targets listed include BMO (Hold, $260, Oct. 21), Truist (Hold, $240), Jefferies (Hold, $264), Morgan Stanley ($310), Bernstein ($282), Barclays (Equal Weight, $308), RBC ($335), UBS ($350), Baird ($351) and Mizuho ($351).
5.4 Short interest
[OUTSIDE CLAIM] FINRA data show short interest of 20,982,242 shares at the Sept. 30, 2026 settlement date, about 1.0 day of average daily volume (FINRA). [ENB ANALYSIS] That is about 7.1% of the 294.5 million shares outstanding (ENB calculation), and about half the 39,427,474 shares short a year earlier (Sept. 30, 2025; FINRA). Benzinga, using a float of about 258.7 million shares, puts the latest figure at 8.11% of float (Benzinga); ENB could not load that page directly. Hunterbrook Capital disclosed a short position when it published its July 2026 reports (Hunterbrook).
5.5 The data-center deals, checked against primary sources
| Partner | What was announced | Status / caveat | Source |
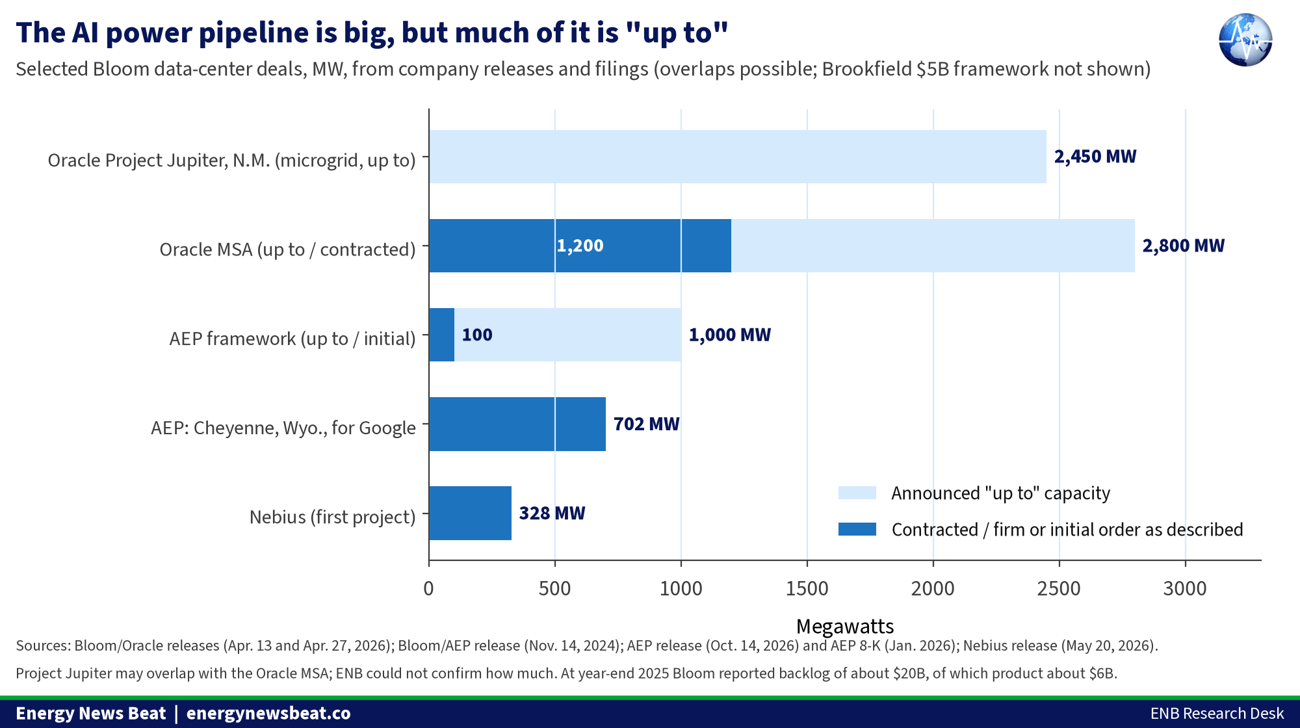
| AEP | Up to 1 GW of fuel cells; initial 100 MW order (Nov. 14, 2024). Bloom cited “100 MW per acre.” | A framework, not a firm 1 GW order | Bloom |
| AEP | AEP unit committed to buy a “substantial portion” of a 900 MW option, about $2.65 billion, for a 20-year deal with a high-investment-grade customer near Cheyenne, Wyo. (Jan. 2026) | Firm purchase commitment per AEP | AEP 8-K |
| AEP / Google | AEP plans to invest ~$4 billion in a 702 MW Bloom fuel-cell plant near Cheyenne under a 20-year PPA with Google; construction 2026, full operation by end of 2028; plans for carbon capture (Oct. 14, 2026) | $4B is AEP’s total investment, not Bloom revenue; likely overlaps the 900 MW option | AEP |
| Brookfield | Up to $5 billion to deploy Bloom fuel cells; Bloom is preferred on-site power provider (Oct. 13, 2025) | Brookfield JVs are related parties; Bloom owns 9.9–15.0% | Bloom; Q2 10-Q |
| Oracle | Master agreement for up to 2.8 GW; 1.2 GW contracted, deploying into 2027 (Apr. 13, 2026) | Oracle also got a warrant (exercised) | Bloom; 8-K |
| Oracle / Project Jupiter | Up to 2.45 GW microgrid for a data-center campus in Doña Ana County, N.M., in place of gas turbines and diesel; ~92% lower NOx than the gas turbines previously planned (Apr. 27, 2026) | Air permit contested; force majeure notice Sept. 24; pipeline delayed (section 9) | Oracle; ENR |
| Nebius | First project 328 MW, operational in 2026 (May 20, 2026) | — | Nebius |
6. Costs vs. alternatives
[BLOOM SAYS] Bloom does not publish a price per kilowatt, a levelized cost of energy (LCOE), or the cost of replacing its power modules. It does give the inputs that matter most: efficiency and heat rate (datasheet). [ENB ANALYSIS] So ENB built a rough estimate from public numbers and compared it with Lazard’s July 2026 LCOE study (Lazard v19.0), which no longer includes fuel cells.
| Technology | Unsubsidized LCOE, $/MWh | Key assumptions | Source |
| New gas combined cycle (CCGT) | 51–129 (avg. 90) | $1,450–2,100/kW; heat rate 6,475–6,550; capacity factor 90% (low case) to 30% (high case); gas $3.45/MMBtu | Lazard v19.0 |
| New gas peaker | 144–276 (avg. 210) | $1,100–1,650/kW; heat rate 10,275–11,175; capacity factor 15–10% | Lazard v19.0 |
| Bloom fuel cell, no tax credit (ENB illustrative) | 72–122 | $2,944–$5,698/kW; heat rate 5,811–7,127; 90% capacity factor; 20 years; 7.7% capital charge; O&M incl. module swaps $15–25/MWh (assumed) | ENB calculation (section D) |
| Bloom fuel cell, 30% ITC (ENB illustrative) | 61–100 | Same, with 30% credit under §48E(j) | ENB calculation; §48E(j) |
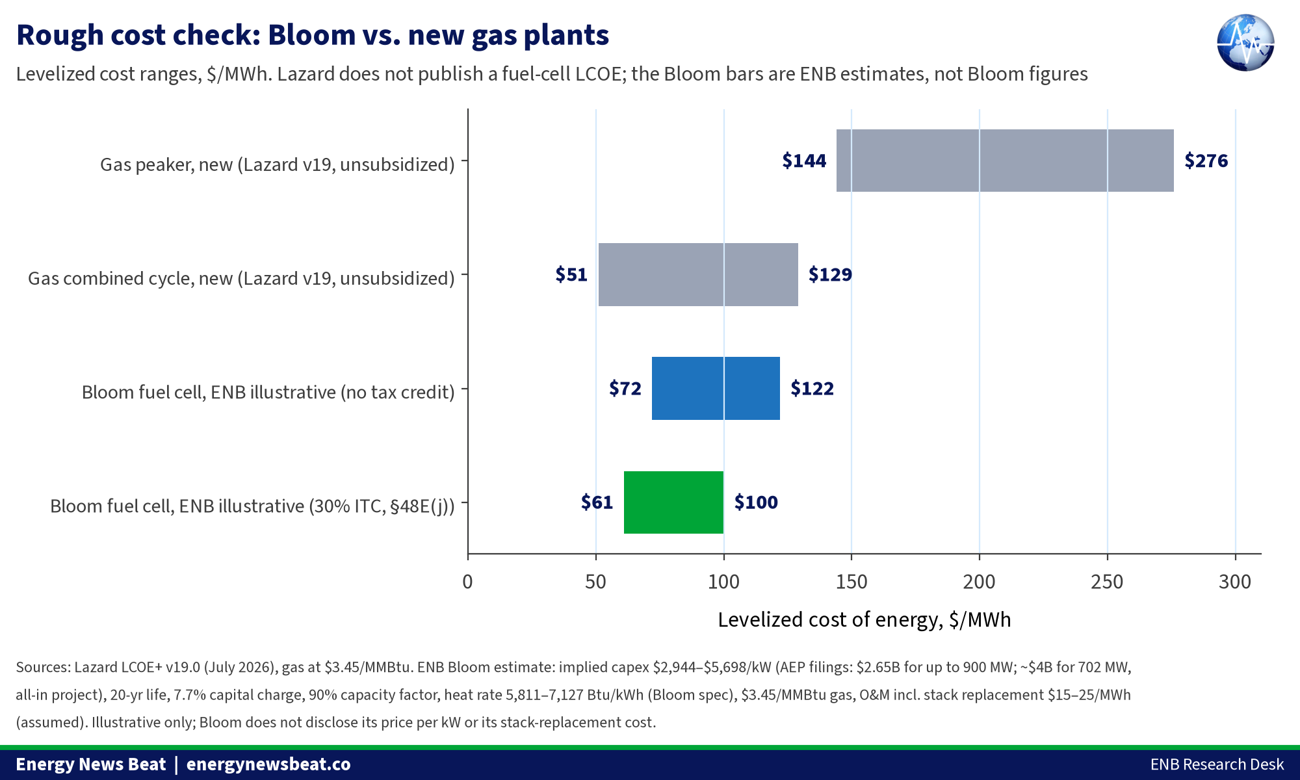
- [ENB ANALYSIS] Where the capital cost range comes from. AEP’s January 2026 8-K put its commitment at about $2.65 billion for a “substantial portion” of a 900 MW option (AEP 8-K). If that covered the full 900 MW, it would be about $2,944/kW; it is likely higher per kW because it covers only part. AEP’s Oct. 14 release puts its total planned investment in the 702 MW Cheyenne project at about $4 billion (AEP), or about $5,698/kW. That is an all-in project figure, possibly including carbon capture, not Bloom’s equipment price. Neither number is Bloom’s list price.
- [ENB ANALYSIS] Service cost cross-check. Bloom’s 2025 service revenue was $228.3 million (Q4 release). Spread across a fleet of more than 5 GW (datasheet), that is about $152/kW-year, or about $19.3/MWh at a 90% capacity factor. That supports the $15–25/MWh O&M assumption, but it is rough: not every system is on a Bloom service contract.
- [ENB ANALYSIS] Fuel matters. At a mid-life heat rate of about 6,469 Btu/kWh, each $1/MMBtu change in gas price moves Bloom’s cost by about $6.5/MWh. Fuel is about $20–25/MWh of the estimate at $3.45 gas.
- [ENB ANALYSIS] What the comparison says. A big new combined-cycle plant running around the clock (the low end of Lazard’s range, about $51/MWh) is cheaper per MWh than Bloom’s estimated range. Bloom competes on other things: speed and siting. Lazard says “gas turbine supply is constrained, extending development timelines well beyond historical norms” (Lazard v19.0). Bloom’s 10-K cites customers’ “time to power needs” and says “an increasing number of transactions move from a booking to revenue in less than twelve months” (2025 10-K). Against the on-site alternatives data centers actually use, simple-cycle turbines and engines, Bloom’s estimated cost and emissions both look better.
- [BLOOM SAYS] Tax credits. Under the 2022 Inflation Reduction Act, natural-gas fuel cells lost the investment tax credit after Dec. 31, 2024, except for safe-harbored projects. Bloom says the July 4, 2025 tax law “restored the federal ITC for applicable fuel cell property for projects beginning construction after December 31, 2025, at a 30% rate through 2033, regardless of the level of emissions from the fuel cell property,” and restored accelerated depreciation (2025 10-K). [ENB ANALYSIS] The statute, 26 U.S.C. §48E(j), sets the rate for qualified fuel cell property at 30%, which “shall not be increased or otherwise adjusted” by the bonus adders. It switches off, for fuel cells, both the requirement that a facility’s greenhouse-gas emissions rate be “not greater than zero” and the rule that recaptures the credit if a facility’s emissions rate exceeds 10 grams of CO2e per kWh. The Dec. 31, 2025 construction-start date comes from the law’s effective-date note (Pub. L. 119-21, §70513(g)) (S. Code). Bloom warns that new “prohibited foreign entity” rules could limit eligibility (2025 10-K).
7. Fuel and emissions: testing the “clean energy” claim
[BLOOM SAYS] Bloom calls its systems “clean” and says its natural-gas servers are “an important source of near-term emission reductions” (2025 10-K). The same filing is clear about the fuel: “While most Energy Server deployments use natural gas as fuel, there is no combustion.” Its partners say the same. AEP describes the Cheyenne project as generating electricity “without combustion of natural gas” (AEP).
7.1 What fuel does the fleet run on?
- [BLOOM SAYS] The last hard number is from 2018. Bloom’s IPO prospectus said, “As of March 31, 2018, approximately 9% of our deployed fleet of Energy Servers, by megawatts deployed, utilized biogas” (IPO prospectus). The rest ran on natural gas.
- [ENB ANALYSIS] Bloom’s current filings say only “most.” ENB found no fleet-wide fuel split in the 2025 10-K, the Q2 2026 10-Q or the 2025 Impact Report. Bloom does not disclose how many megawatts run on biogas or hydrogen. The new AI data-center projects ENB reviewed (AEP/Google in Wyoming, Oracle’s Project Jupiter in New Mexico) are designed around pipeline natural gas (AEP; ENR). With the fleet at more than 1.5 GW and growing mostly through data centers, ENB expects the natural-gas share is at least as high as in 2018, but cannot confirm it.
[OUTSIDE CLAIM] Hindenburg Research, which was short Bloom, cited the same 2018 prospectus in 2019 to say that 91% of Bloom’s systems ran on natural
7.2 CO2 per megawatt-hour
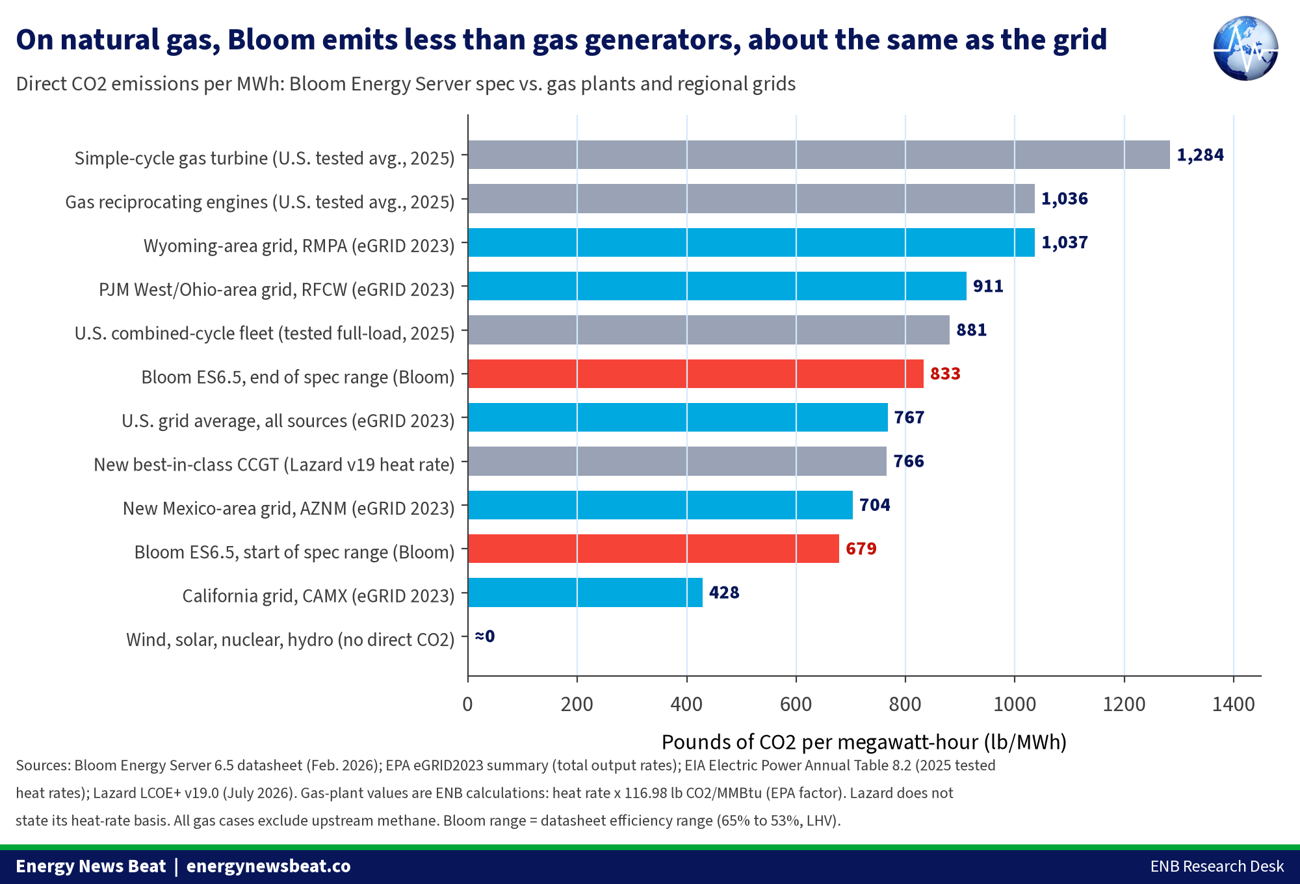
LCOE+ v19.0; ENB calculations.
| Comparison (lb CO2/MWh) | Rate | Bloom 679–833 vs. this | Source |
| U.S. grid average, all sources (2023) | 767 | −11% to +9% | eGRID2023 |
| U.S. grid, EIA all sources (2023) | ~810 (0.81 lb/kWh) | −16% to +3% | EIA FAQ |
| U.S. combined-cycle fleet (2025 tested full-load heat rate 7,535) | ~881 | −23% to −5% | EIA Table 8.2; ENB |
| U.S. gas fleet, operating (2025 heat rate 7,781) | ~910 | −25% to −8% | EIA Table 8.1; ENB |
| New best-in-class CCGT (Lazard heat rate 6,475–6,550) | ~757–766 | about −11% to +10% | Lazard; ENB |
| Gas reciprocating engines (2025 tested 8,853) | ~1,036 | −34% to −20% | EIA Table 8.2; ENB |
| Simple-cycle gas turbines (2025 tested 10,975) | ~1,284 | −47% to −35% | EIA Table 8.2; ENB |
| Wyoming-area grid, RMPA | 1,037 | −35% to −20% | eGRID2023 |
| New Mexico-area grid, AZNM | 704 | −4% to +18% | eGRID2023 |
| PJM West/Ohio-area grid, RFCW | 911 | −25% to −9% | eGRID2023 |
| California grid, CAMX | 428 | +59% to +95% | eGRID2023 |
[ENB ANALYSIS] Gas-plant rates are ENB calculations: heat rate (Btu/kWh) × 116.98 lb CO2 per MMBtu, EPA’s natural-gas factor of 53.06 kg/MMBtu (EPA). EIA heat rates are on a higher-heating-value basis; Lazard does not state its basis. None of these figures includes methane leaked upstream in gas production and transport, which would raise every gas-fired option, Bloom included, in proportion to the gas burned.
- [BLOOM SAYS] Fleet total. Bloom’s 2025 Impact Report puts Scope 1 emissions at 2,938,210 tonnes CO2e, nearly all from its products in the field. It also claims 1,785,670 tonnes of “avoided” emissions (Impact Report).
- [ENB ANALYSIS] How Bloom gets “avoided” emissions. Bloom compares its servers with the marginal (non-baseload) grid, the fossil plants that would ramp up or down at the margin, using EPA eGRID non-baseload rates (Impact Report). AEP’s 2024 release made a similar claim, “34% lower CO2 than displaced marginal generation in PJM” (Bloom/AEP). That is a legitimate comparison for a new load, but it is not the same as saying Bloom is cleaner than the grid on average. Against the average U.S. grid, Bloom on natural gas is about even.
- [BLOOM SAYS] Smog-forming pollution. Bloom’s datasheet lists NOx of 003 lb/MWh (datasheet), and its whole fleet emitted 24,036 lb of NOx in 2025 (Impact Report). [ENB ANALYSIS] Compared with 0.452 lb/MWh for the U.S. grid (eGRID2023), this is Bloom’s clearest environmental advantage. [BLOOM SAYS] Oracle says Bloom fuel cells at Project Jupiter would cut NOx by about 92% compared with the gas turbines previously planned for the site (Oracle).
- [BLOOM SAYS] Carbon capture is a plan, not a fleet. Bloom markets a “high purity CO2 exhaust captured for CO2 utilization or sequestration” (Impact Report), and AEP says the Cheyenne project “includes plans to integrate carbon capture technology” (AEP). ENB found no operating Bloom project capturing CO2 at commercial scale.
7.3 Project Jupiter: what one big site would emit
[OUTSIDE CLAIM] ENR reports that the 2,462 MW Project Jupiter microgrid could use up to 2,275 fuel-cell clusters and up to 375 million standard cubic feet of gas a day, or 136.8 billion cubic feet a year (ENR). [ENB ANALYSIS] At an assumed 1,037 Btu per cubic foot, that much gas at full output works out to a heat rate of about 6,578 Btu/kWh (about 51.9% efficient, HHV) and about 7.53 million tonnes of CO2 a year, about 769 lb/MWh. That matches Bloom’s spec range. [BLOOM SAYS] Oracle says a new operating cap cuts permitted greenhouse-gas emissions from 8.8 million to 5.7 million tons a year, and it plans 100% carbon-free energy matching by 2031 (Oracle).
| The clean-energy verdict (ENB analysis)
[ENB ANALYSIS] Is Bloom Energy “clean energy”? An evidence-based answer. • On natural gas, which is most of the fleet: no, not in the zero-carbon sense. It emits 679–833 lb CO2/MWh, about the same as the average U.S. grid (767) and far more than wind, solar, nuclear or hydro. • Compared with other gas generators: yes, it is cleaner. It emits about 5–23% less CO2 than the U.S. combined-cycle fleet (2025 tested full-load heat rate) and 35–47% less than simple-cycle turbines, and almost no NOx; Bloom says its servers emit “virtually no criteria air pollutants, including NOx or SOx” (IPO prospectus). Against a new best-in-class combined-cycle plant, it is roughly a tie. • On biogas or green hydrogen, or with working carbon capture: it could be close to clean. Bloom has not disclosed how much of its fleet runs that way since 2018 (about 9% biogas then). • The fair label: lower-carbon, low-pollution natural-gas power. It runs on fuel, and Bloom says that fuel is mostly natural gas. |
8. Land and resource needs
- [BLOOM SAYS] Bloom claims about 100 MW per acre (Bloom/AEP). U.S. utility-scale solar plants built in 2019 averaged about 0.18–0.28 MW (AC) per acre (LBNL). The ES 6.5 weighs 28,745 lb per 325 kW server (datasheet). [ENB ANALYSIS] A 1 GW site would need roughly 10 acres of server pads at Bloom’s figure (ENB calculation), before roads, gas equipment, switchgear and setbacks.
- [BLOOM SAYS] Bloom says its servers use no water in normal operation (datasheet) and reports consumption of 0.32 gallons per MWh, only at startup and during maintenance (Impact Report). That is a real advantage over steam-cycle gas plants in dry places like Wyoming and New Mexico.
- [OUTSIDE CLAIM] Gas supply. Large sites need large new pipelines. Project Jupiter depends on Transwestern’s 17.77-mile “Green Chile” lateral, whose in-service date has slipped to February 2027 (ENR).
- [BLOOM SAYS] Materials and waste. Bloom reported 262 tonnes of hazardous waste in 2025, 81% recycled; its waste streams include spent desulfurization material (Impact Report). Solid oxide cells use scandium; Bloom says it has “sufficient supply of scandium oxide” and is “not dependent on China” (8-K). [OUTSIDE CLAIM] Hunterbrook alleges that Bloom relies on Chinese scandium and that 5 GW of cells would need about 220 tonnes of scandium against roughly 240 tonnes of global supply (Hunterbrook). ENB could not verify either side’s numbers.
9. Limitations and risks
- Fleet performance and guarantee costs. [BLOOM SAYS] Bloom’s fuel cells lose efficiency as they age, and its reserves depend on “assumptions regarding improvements in power module life that may fail to materialize” (2025 10-K). In 2018 Bloom said early stacks were replaced every 12 to 18 months, that it expected “over five years between replacements” from 2017 on, and that its service business would break even only if the time between replacements was “five years or better” (IPO prospectus). [OUTSIDE CLAIM] Hunterbrook alleges that, in New York data, 37 systems fell below a 9% efficiency guarantee line at a median of 20 months, and that Bloom deleted a five-year median refurbishment figure from its Impact Report (Hunterbrook). ENB did not replicate that analysis.
- Customer concentration. [BLOOM SAYS] One customer was 73% of Q2 2026 revenue (10-Q/A). A delay by one buyer or financier can swing a quarter.
- Permits and local opposition. [BLOOM SAYS] Bloom’s 10-K warns of “reluctance in certain areas to issue permits for natural gas Energy Server systems,” with conditions that can include “a requirement to blend costly renewable fuels.” New York, New Jersey and North Carolina exempt fuel cells from air permits (2025 10-K). [OUTSIDE CLAIM] At Project Jupiter, updated modeling roughly doubled projected pollutant concentrations (still within EPA limits), New Energy Economy filed a motion to dismiss the permit application, and a hearing on that motion is set for Oct. 26; NMED’s Nov. 23 decision deadline may be extended (Albuquerque Journal). Oracle invoked force majeure on Sept. 24; the developer’s attorney said delays could cost about $325 million a month from November, and New Mexico’s State Land Office cancelled the pipeline’s right-of-way applications on state trust land in March and denied reconsideration July 14 (ENR).
- Natural-gas exposure. Higher gas prices raise customers’ cost of power (about $6.5/MWh per $1/MMBtu; ENB) and pipeline limits can delay projects.
- The 30% credit runs through 2033 (2025 10-K), but foreign-entity rules and future changes could cut it. Tariffs have cut both ways: Bloom recovered $37.4 million of IEEPA tariffs in Q2 2026 (Q2 10-Q).
- Supply chain and IP. [BLOOM SAYS] A WIPO arbitration with former supplier Plansee/GTP over patents and confidential information issued a partial award on Feb. 12, 2026; the parties dispute whether the first phase is resolved, and Bloom “is unable to predict the ultimate outcome” (Q2 10-Q).
- The $2.5 billion 2030 notes convert at about $194.97 a share, below the Oct. 21, 2026 close of $238.53 (Q2 10-Q). Stock-based compensation was $56.4 million in Q2 2026 alone (Q2 release).
- At the Oct. 21, 2026 close, the stock traded at about 22.6x sales for the four quarters through Q2 2026 (ENB calculation), which implies years of fast growth. As of that close it was 31% below its June 22 record (Yahoo Finance).
10. Track record
| Date | Event | Source |
| 2009–2010 | SEC later charged broker Advanced Equities and its co-founders with misleading investors in private offerings for an unnamed Silicon Valley “alternative energy company,” including claims of more than $2 billion of backlog when it “never exceeded $42 million.” Settled in Sept. 2012. The SEC did not name the company; ENB did not confirm its identity. | SEC |
| July 2018 | IPO at $15 a share. Prospectus: early stacks replaced every 12–18 months; about 9% of fleet on biogas. | IPO prospectus |
| Sept. 17, 2019 | Hindenburg Research (short) report: Bloom “never been a ‘green’ energy company,” CO2 “comparable to modern natural gas power plants,” an estimated $2+ billion undisclosed servicing liability, and over $1.1 billion in subsidies. Bloom rejected the report. | Hindenburg; Bloom response |
| Feb.–Mar. 2020 | Restatement: Bloom changed how it accounted for certain managed-services deals. Cumulative revenue was overstated by $192.1 million through Sept. 30, 2019, and cost of revenue by $166.1 million. Management identified a material weakness in internal control. | 2019 10-K |
| 2019–2024 | IPO securities class actions. The federal case (Hunt v. Bloom Energy, N.D. Cal.) settled for $3.0 million in cash. Final approval came May 6, 2024 and final judgment May 9, 2024; Bloom says the settlement was funded entirely by insurers. Related state-court suits led by Lincolnshire Police Pension Fund were filed in March 2019. The Ninth Circuit affirmed dismissal of the claims against PwC on Nov. 10, 2025. | 2024 10-K; settlement notice; Stanford SCAC; Ninth Circuit |
| Feb. 2022–now | Plansee/GTP arbitration over patents and confidential information; partial award Feb. 12, 2026; dispute continues. | Q2 2026 10-Q |
| 2024–2025 | GAAP net losses to common of $29.2 million (2024) and $88.4 million (2025). | Q4 2025 release |
| July 8 & 30, 2026 | Hunterbrook (short) reports on scandium supply, Brookfield-linked revenue and fleet performance. Bloom’s July 9 8-K rejects the scandium claims. | Hunterbrook; Hunterbrook; 8-K |
| July 29, 2026 | 10-Q/A to correct transposed three- and six-month customer-concentration figures. | 10-Q/A |
| Sept.–Oct. 2026 | Project Jupiter: air-permit challenge, Oracle force majeure notice, pipeline delay. | ENR; Albuquerque Journal |
[ENB ANALYSIS] What ENB did not find. ENB found no SEC enforcement action against Bloom Energy itself in the sources reviewed. ENB did not search state court dockets beyond what Bloom discloses, and did not search permit records outside New Mexico.
11. What readers and investors should watch
- Q3 2026 results, Oct. 22 after the close (Bloom). Is revenue on pace for the $3.9–4.2 billion range? Based on the July 28, 2026 guidance, that implied about $1.04–1.19 billion a quarter in the second half (ENB). Is the gross margin near 34% without the one-time tariff refund?
- Customer mix. How much revenue comes from one customer and from Brookfield-linked related parties, and who the end users are.
- Warranty and guarantee lines. Accrued warranty ($77.8 million at June 30), guarantee payments ($13.8 million in H1) and any new “fleet degradation” language (Q2 10-Q).
- Project Jupiter. The Oct. 26 hearing on New Energy Economy’s motion to dismiss the permit application, NMED’s Nov. 23 decision deadline (which may be extended) and the pipeline in-service date (ENR; Albuquerque Journal).
- AEP/Google in Wyoming. Construction start in 2026 and whether carbon capture is actually built (AEP).
- Fuel disclosure. Whether Bloom will publish the share of its fleet running on natural gas, biogas and hydrogen, and its fleet-average efficiency.
- Dilution and cash. Share count, conversions of the 2030 notes, and free cash flow.
- Treasury guidance on §48E(j) and the prohibited-foreign-entity rules.
12. Stu’s Take
| Stu’s Take (opinion of Stu Turley, Energy News Beat)
[STU’S OPINION] I watched Bloom’s video and heard “clean energy.” Then I saw the word “fuel,” and the fuel is natural gas. Bloom’s own 10-K says “most Energy Server deployments use natural gas.” Its own spec sheet says 679 to 833 pounds of CO2 per megawatt-hour. The average U.S. grid is 767. Call it what it is: a cleaner way to turn natural gas into electricity. That’s not an insult. Natural gas keeps the lights on, and I’ll take a box that makes 0.003 lb of NOx per MWh over a diesel generator any day. [STU’S OPINION] Here’s what I like. Data centers need power now, and turbines are back-ordered. Even Lazard says turbine timelines run “well beyond historical norms.” Bloom booked $1.07 billion in revenue in Q2 2026 and made a real GAAP operating profit of $182 million. AEP is putting about $4 billion behind 702 MW for Google in Wyoming. Oracle signed for up to 2.8 GW. That is not a science project. [STU’S OPINION] Here’s what keeps me up. 73% of Q2 2026 revenue came from one customer. By ENB’s math, about 74% of Q4 2025 revenue came from related parties tied to Brookfield. Warranty accruals went from $20 million to $77.8 million in six months, most of it a $58.3 million specific reserve, and the 10-Q ties $4.6 million of guarantee costs to “fleet degradation.” Bloom’s Q2 2026 quarter had a $37.4 million tariff refund in it. And this company has a $192.1 million revenue restatement in its past. [STU’S OPINION] At roughly $70 billion as of the Oct. 21 close, the stock assumes everything goes right for years. Maybe it will. But Washington gave fuel cells a 30% tax credit, in Bloom’s own words, “regardless of the level of emissions”, and I’d like every taxpayer to know that. If you are going to market natural gas power as clean energy and collect a clean-energy-style credit, show us the fleet fuel mix and the fleet efficiency, every year. The last fuel number Bloom gave was 9% biogas, in 2018. Publish the real number, and let people decide. |
13. Open questions and items ENB could not verify
- Q3 2026 results are not out until Oct. 22, 2026 after the close. Every 2026 figure in this report is through Q2.
- Fleet fuel mix. Bloom has not disclosed the share of its fleet on natural gas, biogas or hydrogen since 2018 (about 9% biogas). ENB’s statement that most of the fleet runs on gas rests on Bloom’s word “most.”
- Fleet-average efficiency and stack life. Bloom publishes a spec range, not measured fleet averages, and no current median time between module replacements or replacement cost.
- Hunterbrook allegations (scandium supply, efficiency below guarantees, deleted Impact Report figure, revenue concentration). These come from a firm with a short position. ENB did not replicate the data work; Bloom rejected the scandium claims.
- Implied capital cost. The $2,944–$5,698/kW range comes from AEP’s totals, which may include items other than Bloom equipment. ENB’s LCOE estimate is illustrative only.
- Lazard heat-rate basis. Lazard does not say whether its CCGT heat rates are HHV or LHV; if they are LHV, new CCGT CO2 per MWh would be higher than shown.
- Project Jupiter figures (2,275 clusters, 375 MMscf/d, $325 million a month) come from ENR’s reporting of filings and court statements; Oracle’s “tons” may be short tons. ENB’s 7.5 Mt estimate assumes 1,037 Btu per cubic foot and full output all year.
- Overlap among deals. How much of the 2.45 GW Project Jupiter falls within Oracle’s 2.8 GW agreement, and how much of the 702 MW Cheyenne project falls within AEP’s 900 MW option.
- Market data. Prices from Yahoo Finance and analyst ratings from StockAnalysis and MarketBeat are third-party aggregations. Short-interest shares come from FINRA; the 8.11%-of-float figure is Benzinga’s and could not be loaded directly. The director share sales (Chambers, Immelt) come from third-party market reports; ENB did not open the Form 4s.
- Hunt appeal. ENB did not confirm reports that the Supreme Court declined to review the Ninth Circuit’s PwC ruling in 2026.
- The 2012 SEC case. The SEC did not name the energy company; ENB did not confirm that it was Bloom.
Appendix
A. Sources (all accessed Oct. 21, 2026)
Bloom Energy, Q2 2026 results release (8-K Ex. 99.1), July 28, 2026. https://www.sec.gov/Archives/edgar/data/1664703/000162828026050150/ex991_q226financialresults.htm
Bloom Energy, Q2 2026 supplemental financial information (8-K Ex. 99.2). https://www.sec.gov/Archives/edgar/data/1664703/000162828026050150/ex992q226supplementalfin.htm
Bloom Energy, Form 10-Q for the quarter ended June 30, 2026 (filed July 28, 2026). https://www.sec.gov/Archives/edgar/data/1664703/000162828026050247/be-20260630.htm
Bloom Energy, Form 10-Q/A for the quarter ended June 30, 2026 (filed July 29, 2026). https://www.sec.gov/Archives/edgar/data/1664703/000162828026050325/be-20260630.htm
Bloom Energy, Q1 2026 results release, Apr. 28, 2026. https://www.sec.gov/Archives/edgar/data/1664703/000162828026027913/ex991_q126financialresults.htm
Bloom Energy, Form 10-Q for the quarter ended Mar. 31, 2026. https://www.sec.gov/Archives/edgar/data/1664703/000162828026028021/be-20260331.htm
Bloom Energy, Q4 and full-year 2025 results release, Feb. 5, 2026. https://www.sec.gov/Archives/edgar/data/1664703/000162828026005798/ex991_q42025financialresul.htm
Bloom Energy, Q3 2025 results release, Oct. 28, 2025. https://www.sec.gov/Archives/edgar/data/1664703/000162828025046745/ex991_q32025financialresul.htm
Bloom Energy, Form 10-Q for the quarter ended Sept. 30, 2025. https://www.sec.gov/Archives/edgar/data/1664703/000162828025046844/be-20250930.htm
Bloom Energy, Form 10-K for 2025 (filed Feb. 9, 2026). https://www.sec.gov/Archives/edgar/data/1664703/000162828026006516/be-20251231.htm
Bloom Energy, Form 10-K for 2024 (filed Feb. 27, 2025). https://www.sec.gov/Archives/edgar/data/1664703/000162828025008747/be-20241231.htm
Bloom Energy, Form 10-K for 2019, with restatement (filed Mar. 31, 2020). https://www.sec.gov/Archives/edgar/data/1664703/000166470320000013/a2019q410kbloom.htm
Bloom Energy, IPO prospectus (Form 424B4), July 2018. https://www.sec.gov/Archives/edgar/data/1664703/000119312518227590/d96446d424b4.htm
Bloom Energy, 2026 proxy statement (DEF 14A), Apr. 8, 2026. https://www.sec.gov/Archives/edgar/data/1664703/000162828026024237/be-20260408.htm
Bloom Energy, 8-K on 0% convertible notes due 2030 (Nov. 4, 2025). https://www.sec.gov/Archives/edgar/data/1664703/000162828025049016/be-20251030.htm
Bloom Energy, 8-K on $600 million credit agreement (Dec. 23, 2025). https://www.sec.gov/Archives/edgar/data/1664703/000162828025058618/be-20251219.htm
Bloom Energy, 8-K on Oracle agreement and warrant (Oct. 30, 2025). https://www.sec.gov/Archives/edgar/data/1664703/000162828025047228/be-20251028.htm
Bloom Energy, 8-K on Oracle master agreement and warrant (Apr. 13, 2026). https://www.sec.gov/Archives/edgar/data/1664703/000162828026024896/be-20260413.htm
Bloom Energy, 8-K on CFO appointment (Mar. 26, 2026). https://www.sec.gov/Archives/edgar/data/1664703/000119312526126402/d104322d8k.htm
Bloom Energy, 8-K on CEO performance award (June 17, 2026). https://www.sec.gov/Archives/edgar/data/1664703/000119312526274388/d100413d8k.htm
Bloom Energy, 8-K responding to Hunterbrook (July 9, 2026). https://www.sec.gov/Archives/edgar/data/1664703/000162828026047734/be-20260709.htm
Bloom Energy, response to Hindenburg (8-K Ex. 99.1, 2019). https://www.sec.gov/Archives/edgar/data/1664703/000166470319000028/ex991_responsetohindenburg.htm
SEC EDGAR, Schedule 13G filings for Bloom Energy. https://www.sec.gov/cgi-bin/browse-edgar?action=getcompany&CIK=0001664703&type=SC+13G&dateb=&owner=include&count=40
Bloom Energy, Q3 2026 results date announcement (Oct. 12, 2026). https://investor.bloomenergy.com/press-releases/press-release-details/2026/Bloom-Energy-to-Announce-Third-Quarter-2026-Financial-Results-on-October-22-2026/default.aspx
Bloom Energy Server 6.5 datasheet (Feb. 2026). https://www.bloomenergy.com/wp-content/uploads/bloom-energy-server-datasheet-feb-2026.pdf
Bloom Energy, 2025 Impact Report. https://www.bloomenergy.com/wp-content/uploads/2025-bloom-energy-impact-report.pdf
Bloom Energy, AEP gigawatt agreement release (Nov. 14, 2024). https://www.bloomenergy.com/news/bloom-energy-announces-gigawatt-fuel-cell-procurement-agreement-with-aep-to-power-ai-data-centers/
American Electric Power, Form 8-K (Jan. 2026). https://www.sec.gov/Archives/edgar/data/4904/000000490426000003/aep-20260104.htm
American Electric Power, Cheyenne/Google release (Oct. 14, 2026). https://www.aep.com/news/stories/view/12314/
Bloom Energy and Brookfield, $5 billion partnership release (Oct. 13, 2025). https://www.bloomenergy.com/news/brookfield-and-bloom-energy-announce-5-billion-strategic-ai-infrastructure-partnership/
Bloom Energy and Oracle, 2.8 GW release (Apr. 13, 2026). https://www.bloomenergy.com/news/bloom-energy-and-oracle-expand-strategic-partnership-to-deploy-up-to-2-8-gw-to-accelerate-ai-infrastructure-build-out/
Oracle, Project Jupiter fuel-cell release (Apr. 27, 2026). https://www.oracle.com/news/announcement/oracle-borderplex-and-bloom-energy-to-power-project-jupiter-with-fuel-cell-technology-2026-04-27/
Oracle, Project Jupiter emissions-cap release (Oct. 15, 2026). https://www.oracle.com/news/announcement/project-jupiter-microgrid-cuts-permitted-emissions-by-35-percent-2026-10-15/
ENR, “Oracle invokes force majeure as New Mexico Project Jupiter power work faces hurdles” (Sept. 28, 2026). https://www.enr.com/articles/63720-oracle-invokes-force-majeure-as-new-mexico-project-jupiter-power-work-faces-hurdles
Albuquerque Journal, “New challenge to Project Jupiter air permit” (Oct. 15, 2026). https://www.abqjournal.com/news/new-challenge-to-project-jupiter-air-permit/3143387
Nebius, Bloom partnership release (May 20, 2026). https://nebius.com/newsroom/nebius-and-bloom-energy-partner-to-power-ai-infrastructure-build-out
Hunterbrook, “Bloom’s Big Lie” (July 8, 2026). https://newsletter.hntrbrk.com/p/blooms-big-lie
Hunterbrook, “Do Bloom’s Fuel Cells Work as Claimed? Data Says No” (July 30, 2026). https://newsletter.hntrbrk.com/p/do-blooms-fuel-cells-work-as-claimed
Hindenburg Research, Bloom Energy report (Sept. 17, 2019). https://hindenburgresearch.com/bloom-energy-a-clean-energy-darling-wilting-to-its-demise/
U.S. Court of Appeals for the Ninth Circuit, Hunt v. PricewaterhouseCoopers LLP, No. 24-3568 (Nov. 10, 2025). https://cdn.ca9.uscourts.gov/datastore/opinions/2025/11/10/24-3568.pdf
SEC press release 2012-191 (Advanced Equities), Sept. 18, 2012. https://www.sec.gov/newsroom/press-releases/2012-2012-191htm
EPA, eGRID summary data (eGRID2023). https://www.epa.gov/egrid/summary-data
EPA, GHG Emission Factors Hub. https://www.epa.gov/climateleadership/ghg-emission-factors-hub
EIA, FAQ: CO2 emitted per kWh. https://www.eia.gov/tools/faqs/faq.php?id=74&t=11
EIA, Electric Power Annual Table 8.2 (tested heat rates). https://www.eia.gov/electricity/annual/html/epa_08_02.html
EIA, Electric Power Annual Table 8.1 (operating heat rates). https://www.eia.gov/electricity/annual/html/epa_08_01.html
Lazard, Levelized Cost of Energy+ (Version 19.0, July 2026). https://www.lazard.com/media/kcfconhf/lazards-lcoeplus_vf.pdf
U.S. Code, 26 U.S.C. §48E (clean electricity investment credit). https://uscode.house.gov/us/usc/119-118/t26/s48E/
Yahoo Finance, BE quote and history. https://finance.yahoo.com/quote/BE/
Yahoo Finance, S&P 500 quote and history. https://finance.yahoo.com/quote/%5EGSPC/
StockAnalysis, BE analyst forecast. https://stockanalysis.com/stocks/be/forecast/
MarketBeat, BE analyst forecast. https://www.marketbeat.com/stocks/NYSE/BE/forecast/
FINRA, equity short interest data (BE, settlement dates Sept. 30, 2026 and Sept. 30, 2025). https://www.finra.org/finra-data/browse-catalog/equity-short-interest/data
Benzinga, BE short interest (could not be loaded directly; cited for % of float only). https://www.benzinga.com/quote/BE/short-interest
Hunt v. Bloom Energy (N.D. Cal.), notice of proposed settlement. https://shareholdersfoundation.com/sites/default/files/2024-03/BE_Settlement_Notice_6_30_2023.pdf
Stanford Securities Class Action Clearinghouse, Bloom Energy case page. https://securities.stanford.edu/filings-case.html?id=107025
Bolinger and Bolinger (LBNL), “Land Requirements for Utility-Scale PV,” IEEE Journal of Photovoltaics, 2022. https://www.energy.gov/sites/default/files/2022-01/lbnl_ieee-land-requirements-for-utility-scale-pv.pdf
B. Key filing excerpts
“While most Energy Server deployments use natural gas as fuel, there is no combustion.” (2025 Form 10-K)
“During normal operations using natural gas or biogas-fuel sources, the Energy Server system vents carbon dioxide (“CO2”) into the atmosphere as a byproduct.” (2025 Form 10-K)
“…restored the federal ITC for applicable fuel cell property for projects beginning construction after December 31, 2025, at a 30% rate through 2033, regardless of the level of emissions from the fuel cell property.” (2025 Form 10-K)
“…reluctance in certain areas to issue permits for natural gas Energy Server systems… including a requirement to blend costly renewable fuels.” (2025 Form 10-K)
“…assumptions regarding improvements in power module life that may fail to materialize.” (2025 Form 10-K)
“…higher product performance guarantee costs of $3.0 million and $4.6 million… reflecting the effects of fleet degradation.” (Q2 2026 Form 10-Q)
“As of March 31, 2018, approximately 9% of our deployed fleet of Energy Servers, by megawatts deployed, utilized biogas.” (IPO prospectus, 2018)
“…in the early years, replacement was typically 12 to 18 months… from 2017 onwards we expect to average over five years between replacements.” “…we believe we can break-even in our service business provided the time between stack replacements across all of our fleet is five years or better.” (IPO prospectus, 2018)
“The correction of the misstatements resulted in a cumulative overstatement of revenue totaling $192.1 million through September 30, 2019…” (2019 Form 10-K)
“As our fuel cells age, efficiency decreases, and replacements are made.” (2025 Impact Report)
Bloom has “sufficient supply of scandium oxide” and is “not dependent on China.” (8-K, July 9, 2026)
C. Data tables
Table C1. Bloom quarterly results, $ millions (as reported; as of July 28, 2026 release)
| Quarter | Revenue | Gross profit | GAAP GM | Op. income | Adj. EBITDA | Op. cash flow | Capex | FCF (ENB) |
| Q1 2025 | 326.0 | 88.7 | 27.2% | -19.1 | 25.2 | -110.7 | 14.3 | -124.9 |
| Q2 2025 | 401.2 | 107.1 | 26.7% | -3.5 | 41.2 | -213.1 | 7.2 | -220.4 |
| Q3 2025 | 519.0 | 151.7 | 29.2% | 7.8 | 59.3 | 19.7 | 12.3 | 7.4 |
| Q4 2025 | 777.7 | 239.9 | 30.8% | 87.5 | 146.1 | 418.1 | 23.0 | 395.1 |
| Q1 2026 | 751.1 | 225.5 | 30.0% | 72.2 | 143.0 | 73.6 | 26.2 | 47.4 |
| Q2 2026 | 1,065.4 | 355.6 | 33.4% | 182.2 | 253.4 | 226.4 | 51.6 | 174.8 |
Sources: Bloom quarterly results releases (Q3 2025, Q4 2025, Q1 2026, Q2 2026). Q1 and Q2 2025 figures are the prior-year columns in the 2026 releases.
Table C2. Emission and heat-rate benchmarks (as of the dates shown)
| Benchmark | Value | Data year / as of | Source |
| Bloom ES 6.5 heat rate (HHV) | 5,811–7,127 Btu/kWh | Feb. 2026 datasheet | Bloom |
| Bloom ES 6.5 CO2 | 679–833 lb/MWh | Feb. 2026 datasheet | Bloom |
| U.S. total output CO2 / CO2e / NOx | 767.209 / 770.884 / 0.452 lb/MWh | eGRID2023 (Rev. 2, June 2025) | EPA |
| eGRID subregions RFCW / RMPA / AZNM / ERCT / CAMX | 911.424 / 1,036.601 / 703.703 / 733.862 / 428.464 lb/MWh | eGRID2023 | EPA |
| U.S. CO2, all sources; natural gas | 0.81 lb/kWh; 0.96 lb/kWh | 2023 | EIA |
| Tested heat rates: NGCC / gas turbine / internal combustion | 7,535 / 10,975 / 8,853 Btu/kWh | 2025 | EIA |
| Operating heat rate, gas fleet | 7,781 Btu/kWh | 2025 | EIA |
| Natural-gas CO2 factor | 53.06 kg/MMBtu (116.98 lb/MMBtu) | EPA factors hub | EPA |
| Lazard CCGT / peaker LCOE | $51–129 / $144–276 per MWh | v19.0, July 2026 | Lazard |
Table C3. Market data (as of Oct. 21, 2026)
| Item | Value | Source |
| BE close | $238.53 (3:00 p.m. CT) | Yahoo Finance |
| S&P 500 close | 7,757.17 (3:31 p.m. CT) | Yahoo Finance |
| Shares outstanding | 294,527,346 (July 22, 2026) | Q2 10-Q |
| Short interest | 20,982,242 shares; 1.03 days to cover (Sept. 30, 2026 settlement); ~7.1% of shares outstanding (ENB) | FINRA |
| Analyst average target | $285.43 (29 analysts); $261.55 (26 analysts) | StockAnalysis; MarketBeat |
D. ENB calculations
| Calculation | Result |
| Q2 2026 free cash flow: $226.4M − $51.6M | $174.8M |
| Revenue, 4 quarters through Q2 2026: 519.0 + 777.7 + 751.1 + 1,065.4 | $3,113.2M |
| Adj. EBITDA, 4 quarters through Q2 2026: 59.3 + 146.1 + 143.0 + 253.4 | $601.8M |
| Net income to common, 4 quarters through Q2 2026: −23.1 + 1.1 + 70.7 + 196.3 | $245.0M |
| Free cash flow, 4 quarters through Q2 2026 (sum of quarterly OCF − capex) | $624.7M |
| Tariff effect on Q2 GM: $37.4M ÷ $1,065.4M; (355.6 − 37.4) ÷ 1,065.4 | 3.5 pts; 29.9% |
| Related-party share: Q4 2025 574.2 ÷ 777.7; FY2025 892.0 ÷ 2,024.0 | 73.8%; 44.1% |
| H2 2026 implied revenue: (3,900 to 4,200) − 1,816.4 | $2,083.6–2,383.6M |
| Market value: $238.53 × 294.527M | $70.3B |
| Enterprise value: 70.3 + 2.530 − 2.689 | $70.1B |
| P/S (Oct. 21 close; 4 quarters through Q2 2026); P/S on $4.05B guidance | 22.6x; 17.4x |
| EV/EBITDA and P/E (4 quarters through Q2 2026); P/E on $2.70 non-GAAP EPS | 116x; 287x; 88x |
| Returns: 238.53 ÷ 86.89 / 104.38 / 11.31 / 21.20 − 1 | +174.5% / +128.5% / +2,009% / +1,025% |
| S&P 500 returns (YTD / 1y / 3y / 5y) | +13.3% / +15.2% / +83.6% / +70.5% |
| Drawdown from record: 238.53 ÷ 345.85 − 1 | -31.0% |
| Convert dilution: 19.554M ÷ 294.5M | 6.6% |
| Short interest share: 20.982M ÷ 294.527M; vs. year earlier 20.982M ÷ 39.427M | 7.1%; 53% of year-earlier level |
| CO2 from heat rate: Btu/kWh × 116.98 ÷ 1,000 (e.g., 7,535 → 881; 10,975 → 1,284; 8,853 → 1,036; 7,781 → 910; 6,550 → 766) | lb/MWh |
| Bloom vs. U.S. grid: 679 ÷ 767.2 − 1; 833 ÷ 767.2 − 1 | −11%; +9% |
| Bloom vs. NGCC fleet: 679 ÷ 881 − 1; 833 ÷ 881 − 1 | −23%; −5% |
| HHV efficiency: 3,412 ÷ 5,811; 3,412 ÷ 7,127 | 58.7%; 47.9% |
| Project Jupiter: 136.8B scf × 1,037 Btu ÷ (2,462 MW × 8,760 h) | 6,578 Btu/kWh; 51.9% HHV |
| Project Jupiter CO2: 136.8B scf × 1,037 Btu × 53.06 kg/MMBtu | 7.53 Mt/yr; 769 lb/MWh |
| Implied capex: $2.65B ÷ 900 MW; $4.0B ÷ 702 MW | $2,944/kW; $5,698/kW |
| Capital recovery factor, 7.7%, 20 years | 0.09959 |
| LCOE = capex × (1 − ITC) × CRF ÷ (0.90 × 8.76) + heat rate × $3.45 ÷ 1,000 + O&M | Low $72 (capital 37 + fuel 20 + O&M 15); high $122 (capital 72 + fuel 25 + O&M 25); with ITC $61–100 |
| Service revenue per kW: $228.3M ÷ 1,500 MW; ÷ (0.9 × 8.76) | $152/kW-yr; $19.3/MWh |
| Gas-price sensitivity: 6,469 Btu/kWh × $1/MMBtu | $6.5/MWh |
| Land: 1,000 MW ÷ 100 MW/acre | 10 acres |
E. Methodology
- ENB reviewed Bloom’s SEC filings (10-K, 10-Q, 10-Q/A, 8-K, proxy, IPO prospectus), results releases, product datasheet and Impact Report; partner releases and filings (AEP, Oracle, Brookfield, Nebius); federal data (EPA eGRID, EIA); Lazard’s LCOE+; the U.S. Code; court opinions; short-seller reports; and press coverage of Project Jupiter. ENB did not contact Bloom or any other party.
- Claim tags. [BLOOM SAYS] statements quote or paraphrase Bloom’s own documents. [ENB ANALYSIS] statements are ENB arithmetic or comparisons. [OUTSIDE CLAIM] statements are claims by outside parties, including short sellers who profit if the stock falls; ENB reports them as allegations. [STU’S OPINION] appears only in Stu’s Take.
- Margins, free cash flow (operating cash flow − purchases of property, plant and equipment), trailing sums and multiples are ENB calculations from reported figures. Trailing figures cover Q3 2025 through Q2 2026. Multiples use the Oct. 21, 2026 close and will change with Q3 results.
- Stock data. Daily closes from Yahoo Finance. Returns compare the Oct. 21, 2026 close with the last close on or before each base date. Chart 3 plots every daily close.
- Gas-plant CO2 rates convert EIA and Lazard heat rates with EPA’s 53.06 kg CO2/MMBtu factor. Bloom’s figures are its datasheet range, not measured fleet averages. Grid rates are eGRID2023 total-output rates. Upstream methane is excluded for all gas cases.
- ENB’s Bloom estimate is a simple levelized calculation with no construction-period interest, taxes other than the ITC, inflation, degradation curve, gas-price escalation, interconnection or backup. It is meant only to show the order of magnitude. Lazard uses a fuller model (60% debt at 8%, 40% equity at 12%), so the comparison is approximate.
- All times are U.S. Central Time.
Disclaimer
This report is published by Energy News Beat for information and education only. It is not investment, legal, tax or financial advice, and it is not a recommendation to buy, sell or hold Bloom Energy or any other security. Figures are drawn from the public sources cited, as of the dates shown, and may change; ENB calculations and estimates are labeled and may contain errors. Short-seller and press claims are reported as allegations. Stu’s Take is opinion. Readers should do their own research and consult a licensed adviser before making investment decisions.

