


As of mid-to-late October 2026, U.S. drilling activity shows modest weekly stability or small gains depending on the source, set against a solidly higher year-over-year base. Oil-directed activity continues to dominate; the Permian remains the clear leader, and inventory data point to tighter crude and gasoline stocks alongside a distillate build that still leaves supplies below historical norms.
The three main rig-count providers use different methodologies, so headline totals differ while the directional story aligns.
| Source | Latest Total | Week Change | Year Change | Oil | Gas | Notes |
|---|---|---|---|---|---|---|
| Baker Hughes (week ending Oct. 16, 2026) | 603 | 0 | +55 (from 548) | 459 (−3) | 133 (+1) | Misc. 11 (+2); offshore 13 (+1); Canada 217 (−5) |
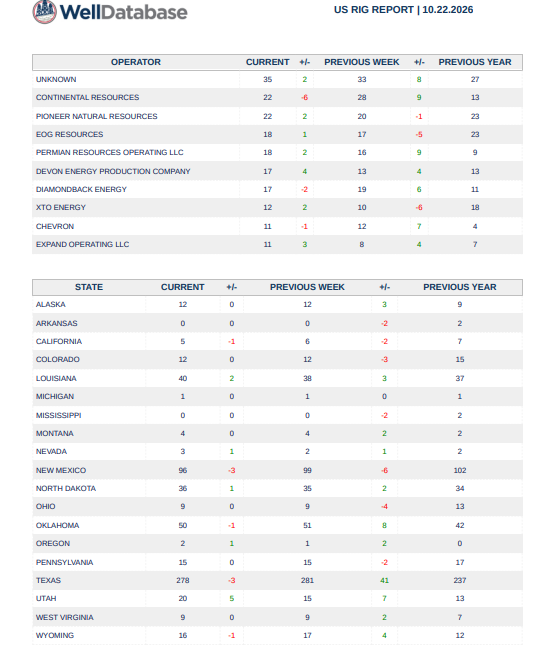
| WellDatabase (US Rig Report 10.22.2026) | 608 | +1 | +54 | 432 (−3) | 129 (+1) | Undisclosed 36 (+1); Thermal 10 (+2); horizontal 509 (−7); vertical 56 (+7) |
| Enverus (Daily Rig Count, ~Oct. 17, 2026) | 664 | ~0% (flat week) | Strongly higher baseline | Broader oil-weighted strength | — | GPS-tracked daily; captures more of the active fleet |
Baker Hughes is the traditional Friday rotary census markets quote most closely. WellDatabase supplies granular operator, state, basin, well-type, wellbore, and depth detail (often cross-referenced with permits). Enverus tracks a higher share of the working fleet in near real time via GPS and therefore prints the highest total. Together they describe elevated activity relative to a year ago, with only modest week-to-week movement.
Oil vs. Natural Gas
Oil remains the majority of the fleet. On Baker Hughes, oil rigs fell three to 459 while gas rose one to 133 (miscellaneous +2 to 11). WellDatabase shows oil at 432 (−3) and gas at 129 (+1). The year-over-year gains are larger on the oil side across sources. Horizontal drilling still dominates (WellDatabase 509), though vertical wells jumped +7 on that tape.
Key Basins and States
The Permian continues to lead:
- Baker Hughes / WellDatabase area: roughly 272 (down ~2 week-over-week, still ~+21 year-over-year).
- Enverus daily snapshots have shown Permian activity in the low-to-mid 250s recently.
Other notable areas from WellDatabase and Baker Hughes alignments:
- Haynesville: ~56–57 (slight weekly dip or flat; solidly higher year-over-year — a key gas growth region).
- Eagle Ford: 49 (flat, +5 year-over-year).
- Williston: WellDatabase 40 (+1); Baker Hughes nearer the mid-30s.
- Marcellus: 23 (flat).
- Granite Wash / other: modest gains in places.
By state (WellDatabase 10.22.2026):
- Texas 278 (−3)
- New Mexico 96 (−3)
- Oklahoma 50 (−1)
- Louisiana 40 (+2)
- North Dakota 36 (+1)
- Utah 20 (+5 — notable weekly jump)
- Smaller gains or flat in several others; Alaska 12 (flat).
Top operators on the WellDatabase report included Unknown (35), Continental Resources (22, −6 week), Pioneer Natural Resources (22, +2), EOG (18), Permian Resources Operating (18), and Devon (17, +4).
U.S. Oil and Gas Market Snapshot — Inventories
Crude oil (EIA Weekly Petroleum Status Report, week ending October 16, 2026): Commercial stocks fell 3.1 million barrels to 412.5 million barrels, now about 3% below the five-year average. This was a larger draw than many analysts expected. U.S. crude production was reported lower for the week (figures in the ~13.3–13.7 million b/d range depending on the exact series and rounding; one report noted hurricane-related impacts earlier in the period). Refinery inputs ran near 16.6 million b/d at ~93.4% utilization. Total commercial petroleum inventories declined more broadly.
Gasoline: Stocks fell roughly 3 million barrels to about 205.3 million, ~5% below the five-year average.
Distillates (diesel/heating oil): Inventories rose about 1.7 million barrels to 104.3 million, still ~9% below the five-year average.
Natural gas (EIA Weekly Natural Gas Storage Report, week ending October 9, 2026): Working gas in storage stood at 3,567 Bcf after a +67 Bcf injection. Stocks were 143 Bcf below year-ago levels but 45 Bcf above the five-year average and within the five-year historical range. The next storage report (covering the week ending October 16) was due around October 22.
Demand indicators remain constructive: four-week average total products supplied was up year-over-year, though distillate demand showed some softness. Oil prices were firm around the mid-to-upper $90s–$100s for WTI in mid-October readings, with Brent higher.
Bottom Line
The three rig-count tapes show U.S. activity holding near or above the 600 mark on the traditional Baker Hughes measure (higher on Enverus), with a modest weekly outcome and clear year-over-year gains led by oil. The Permian anchors the count, while gas-focused areas such as the Haynesville contribute incremental strength. Inventory draws in crude and gasoline, combined with still-below-average distillate stocks and healthy (but not excessive) natural-gas storage, provide a supportive backdrop for the current drilling pace. Continued operator discipline, price levels, and basin-specific economics will determine whether the modest recent stability turns into further gains or consolidation in the weeks ahead.
We highly recommend WellDatabase; you can sign up for a free account, and the subscription is worth the money.
Appendix: Sources and Links
- WellDatabase US Rig Report (dated 10.22.2026): Uploaded document — total 608 rigs (+1 week, +54 year), with detailed operator, state, well-type, wellbore, depth-range, and basin tables. Key figures: Oil 432 (−3), Gas 129 (+1), Permian 272 (−2), Texas 278 (−3), Utah 20 (+5).
- Baker Hughes North American Rotary Rig Count (week ending October 16, 2026): U.S. total 603 (unchanged), oil 459 (−3), gas 133 (+1), miscellaneous 11 (+2). Up 55 from 548 year-ago. Official overview and archive: https://bakerhughesrigcount.gcs-web.com/rig-count-overview/ and https://bakerhughesrigcount.gcs-web.com/na-rig-count/. Reporting: Oil & Gas 360, TipRanks/The Fly, RBN Energy, Pipe Exchange summaries, Petroleum News, and others.
- Enverus / Drillinginfo Daily Rig Count: Public dashboard showed ~664 as of ~October 17, 2026 (roughly flat week-over-week; higher GPS-tracked baseline). https://app.drillinginfo.com/drc/ and https://www.enverus.com/dailyrigcount/. Basin snapshots (Permian, Anadarko, Gulf Coast/Eagle Ford, Williston, Appalachia, Other) available on the platform. Prior Drilldown averages referenced in industry reporting.
- EIA Weekly Petroleum Status Report (week ending October 16, 2026): Commercial crude 412.5 million barrels (−3.1 million; ~3% below 5-year average); gasoline ~205.3 million (−~3 million; ~5% below 5YA); distillate ~104.3 million (+~1.7 million; ~9% below 5YA). Refinery utilization ~93.4%, inputs ~16.6 million b/d. https://www.eia.gov/petroleum/supply/weekly/ and related tables. Coverage: OilPrice.com, Oil & Gas 360, Morningstar/Dow Jones, etc.
- EIA Weekly Natural Gas Storage Report (week ending October 9, 2026): 3,567 Bcf (+67 Bcf; −143 Bcf year-ago; +45 Bcf vs. 5-year average). https://www.eia.gov/naturalgas/storage.
- Additional context: Primary Vision frac-spread mentions in market coverage; state/basin recaps from RBN Energy, Odessa American, and others.