


London and Brussels agreed on Nov. 20 to join their emissions-trading systems from 2028 and, if legal steps follow, to drop carbon border taxes on each other’s goods. The latest official U.S. state auctions settled between about $32 and $40 an allowance. Britain’s large industrial users paid more than twice the EU-plus-UK median price in late 2025.
Britain and the European Union announced on Nov. 20 that they have finished negotiations to link their emissions-trading systems. From Jan. 1, 2028, subject to ratification, an allowance issued in either market could be used to cover a ton of carbon in either system. The UK government says the deal also creates the conditions for an exemption from the European Union’s carbon border tax for £6.5 billion of British exports.
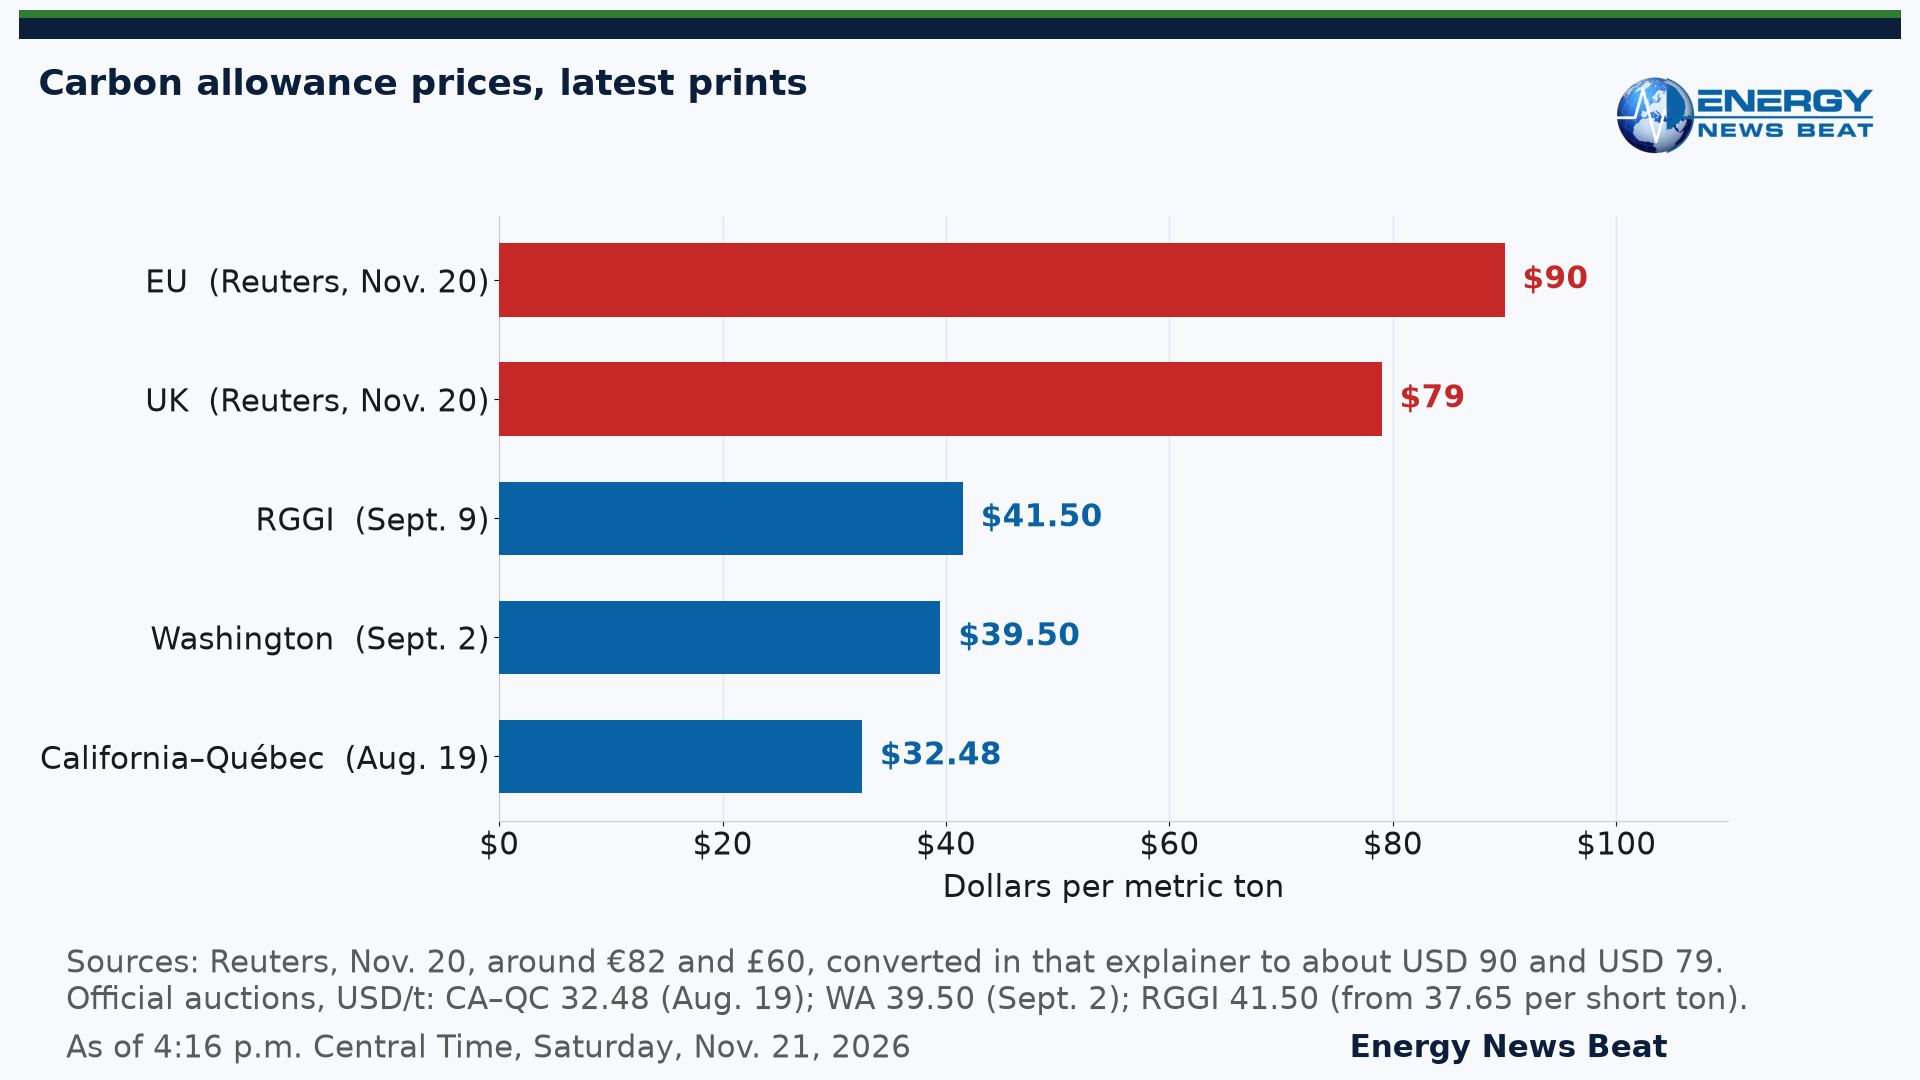
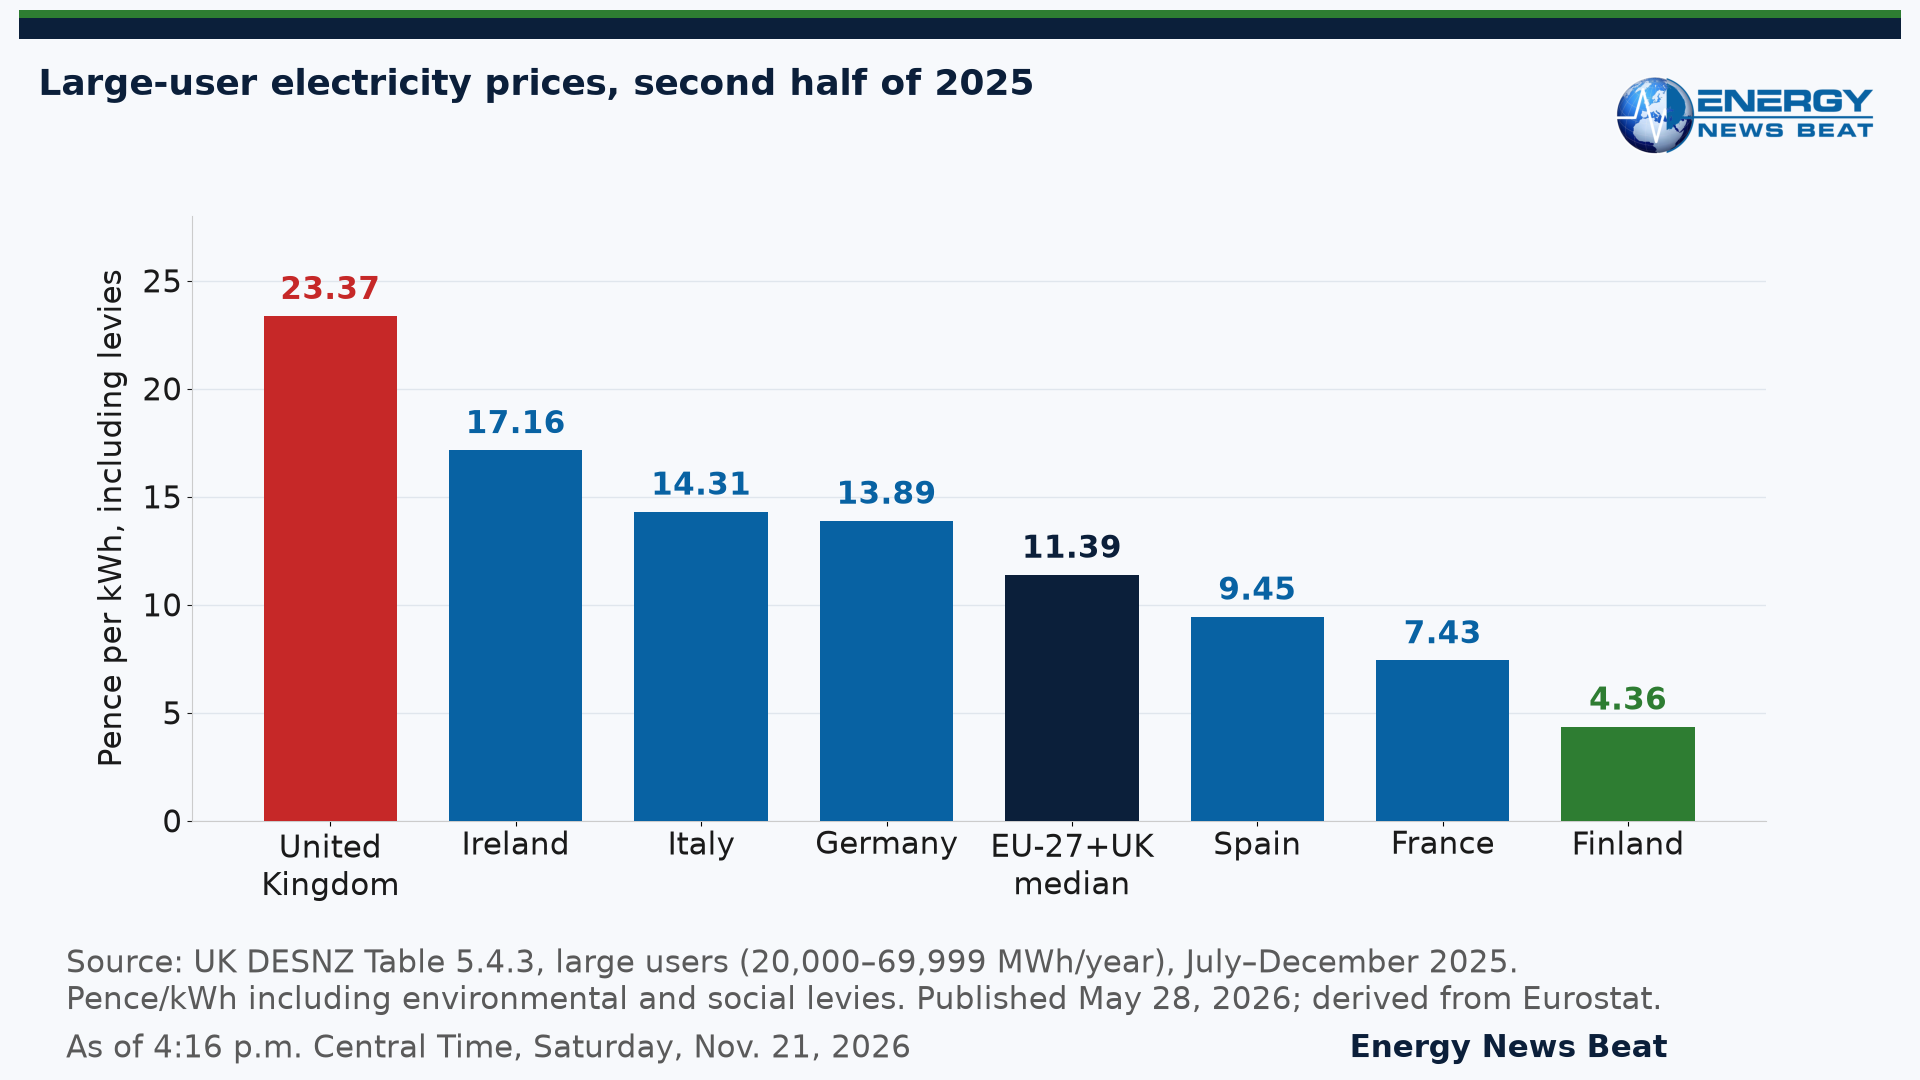
That is a trade arrangement, not a promise of cheaper power. A Reuters explainer published the same day put the benchmark EU allowance around €82 a metric ton and the UK allowance around £60. Official 2026 auctions settled at $32.48 a metric ton in the California-Québec market on Aug. 19, $39.50 in Washington state on Sept. 2, and $37.65 per short ton in the Regional Greenhouse Gas Initiative on Sept. 9. In the second half of 2025, large UK industrial users paid 23.37 pence per kilowatt-hour, more than twice the 11.39 pence EU-and-UK median, according to UK government comparisons drawn from Eurostat. Linking the markets would let permits flow across the Channel. It would not, by itself, close that power-price gap.
What linking actually means
The EU Emissions Trading System, launched in 2005, requires power plants, heavy industry, aviation, and shipping to hold an allowance for each ton they emit under a declining cap. Britain left that system at the end of 2020 and opened its own UK ETS in 2021. From the planned start, an allowance issued in either could be used for compliance in either, including for 2027 emissions. The UK government’s Nov. 20 explainer and the European Commission both name Jan. 1, 2028, as the target, subject to ratification, after a May 2025 summit commitment.
Linking is also the legal on-ramp for dropping carbon border taxes. The EU’s Carbon Border Adjustment Mechanism entered its definitive phase in January 2026 and charges an emissions fee on imports of steel, cement, aluminium, fertilisers, electricity, and hydrogen. The UK plans its own CBAM on Jan. 1, 2027, covering the same sectors except electricity. Under EU law, CBAM does not apply to goods from countries in the EU ETS or linked to it, once they are listed in Annex III. Brussels says it will need a delegated act to add the UK. London intends to exempt goods from the EU, the EEA, and Switzerland from Jan. 1, 2027; London expects the EU exemption from Jan. 1, 2028, once the link is operating and that legal step is done. London also says the agreement will add up to £3.8 billion a year to the UK economy by 2040. The Commission says Britain will expand its ETS, including for aviation and maritime, bringing “over 10 million tonnes of additional CO2 emissions” into the system.
The American map
The United States has no federal cap-and-trade program.
California’s market, long called cap-and-trade and now, by legislative intent, the California Cap-and-Invest Program, was extended through Dec. 31, 2045, by Assembly Bill 1207, signed by Gov. Gavin Newsom on Sept. 19, 2025. It remains linked with Québec. Their latest published joint auction, No. 48 on Aug. 19, 2026, settled at $32.48 a metric ton.
Washington’s Cap-and-Invest Program held Auction 15 on Sept. 2, 2026, at $39.50. The state signed an agreement in June 2026 to link with California and Québec, and expects a shared market in 2027; until then, the prices differ.
The Regional Greenhouse Gas Initiative covers carbon dioxide from power plants in 11 states, including New York, Massachusetts, and Virginia, which resumed participation on July 1, 2026. Auction 73, on Sept. 9, 2026, cleared at $37.65 per allowance, and each allowance authorizes one short ton, not a metric ton. An official RGGI auction notice states that as of Nov. 12, 2025, Pennsylvania is no longer a participating state.
New York already takes part in RGGI for power plants, but a broader, economy-wide cap-and-invest program is not yet an operating market. State law sets a Dec. 31, 2028, deadline for DEC to adopt greenhouse-gas regulations. Oregon runs a Climate Protection Program for fuel suppliers, not a California-style linked allowance market.
The policies that travel with the carbon price
Carbon prices rarely travel alone. Renewable mandates, fuel standards, and vehicle rules sit alongside them.
The UK has already driven coal off its power grid. The Treasury said so on April 16, 2026, in a written statement confirming that Carbon Price Support, an extra levy on fossil fuels used in electricity generation, “will be removed from April 2028.” Reuters described that levy as an extra £18 a ton.
California’s Advanced Clean Cars II program does not currently rest on a federal Clean Air Act waiver. Congress disapproved the Environmental Protection Agency’s waiver in Public Law 119-16, approved June 12, 2025, which states that the waiver “shall have no force or effect.” The disapproval does not, by itself, erase every state’s own statute. California’s Low Carbon Fuel Standard remains in force.
The industrial bill, and the closures already on the record
In the UK energy department’s table for large users, those consuming 20,000 to 69,999 megawatt-hours a year, the second-half-2025 price, including environmental and social levies, was 23.37 pence per kilowatt-hour in the United Kingdom, 14.31 pence in Italy, 13.89 pence in Germany, and 7.43 pence in France, against an EU-27-plus-UK median of 11.39 pence. The UK figure was 105 percent above that median.
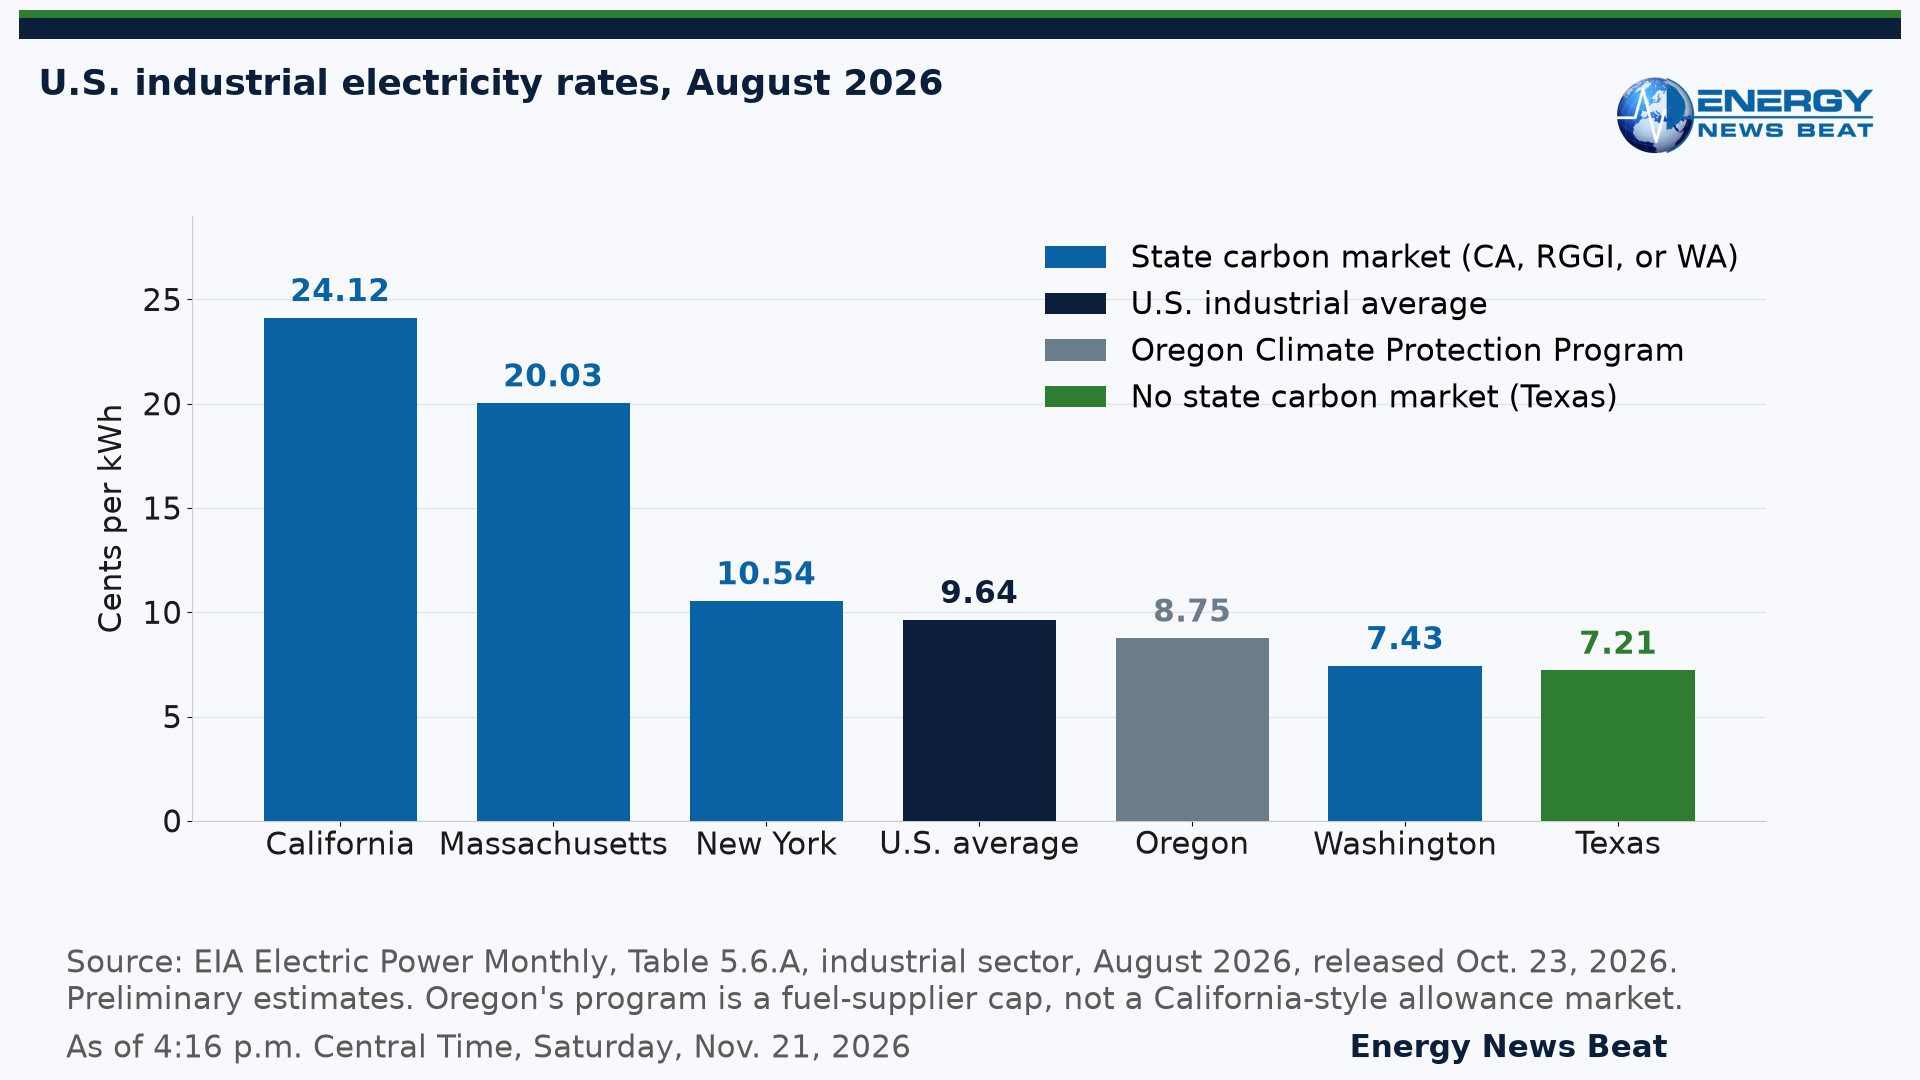
In the United States, the Energy Information Administration’s Table 5.6.A puts the August 2026 industrial average at 9.64 cents per kilowatt-hour. California, which has the oldest economy-wide U.S. carbon market, posted 24.12 cents. Massachusetts, a RGGI state, posted 20.03 cents. New York posted 10.54 cents. Washington, which has both a carbon market and a large hydroelectric system, posted 7.43 cents, close to Texas at 7.21 cents. A carbon-market label does not, by itself, predict the rate. California is high. Washington is not.
Cefic, the European chemical industry council, reported that EU27 chemical output fell 2.5 percent in January through September 2025. A December 2025 radar report it commissioned from Roland Berger counted 37 million tonnes of announced chemical capacity closures in Europe from 2022 through Dec. 8, 2025, about 9 percent of European capacity, including 17.2 million tonnes announced in 2025. After confirmed investments, the potential net reduction was 30.2 million tonnes, including 8.0 million in Germany and 4.2 million in the United Kingdom. EUROFER, the European steel association, said in March 2026 that EU steel production fell to a historic low of about 125.8 million tonnes in 2025, and that imports reached a record 29 percent of EU steel consumption in the third quarter of 2025. In Britain, Tata Steel closed the last blast furnace at Port Talbot in 2024 as it prepares an electric-arc furnace. None of those documents isolates the carbon price as the sole cause. Gas prices, weak demand, imports, and a stack of climate and energy policies all appear in the industry groups’ own accounts. The official price tables show a simpler pattern: several jurisdictions with mature carbon markets also post industrial power costs far above those in U.S. states without such markets. That is a correlation worth watching, not a verdict that the allowance price alone closed the plants.
Consumer and Investor Views
Consumer View. A YouGov Eurotrack survey, fielded April 7–23, 2026, among 2,151 adults in Great Britain, found 74 percent supported “Taxes for companies who produce substantial carbon emissions.” Only 18 percent supported increasing fuel duty. Auction proceeds in California and the RGGI states are spent on bill credits, efficiency, and clean energy. A carbon price can be popular in the abstract and painful when it arrives as a power bill. Not investment advice.
Investor View. Dhara Vyas, chief executive of Energy UK, called the Nov. 20 agreement “a real milestone” that would “strengthen industrial competitiveness and enable faster and more cost-effective decarbonisation.” Energy UK said, according to Reuters, that the measure could save UK industry around £800 million a year; the UK government has said the Frontier Economics estimate is cumulative for 2026–2030. The same Reuters explainer said Conservative leader Kemi Badenoch has argued that carbon levies have harmed Britain’s industries and wants them removed. Analysts have said the price difference between the two contracts will close once linking begins, Reuters reported. Linking would enlarge the European market but would not automatically pull American state prices up, or European power prices down. Not investment advice.
Timeline
Key dates for the UK-EU link, the carbon border taxes, U.S. state markets, and the industrial price record used in this article.
- The EU Emissions Trading System launches.
Jan. 1, 2020. The EU ETS is linked with Switzerland’s system, a link the Commission says will remain after the UK deal.
End of 2020 / 2021. Britain leaves the EU ETS and opens the UK ETS.
May 2025. The first UK-EU Summit commits the parties to pursue ETS linking.
June 12, 2025. Public Law 119-16 is approved, disapproving the EPA’s Advanced Clean Cars II waiver, which “shall have no force or effect.”
Sept. 19, 2025. Gov. Gavin Newsom signs AB 1207, extending California’s market through Dec. 31, 2045, and stating the legislature’s intent that it be known as the California Cap-and-Invest Program.
Nov. 12, 2025. Pennsylvania is no longer a RGGI participating state, according to a later official auction notice.
January 2026. The EU CBAM definitive phase begins.
April 16, 2026. The UK Treasury confirms that Carbon Price Support will be removed from April 2028.
June 2026. Washington signs an agreement to link with California and Québec; a shared market is expected in 2027.
July 1, 2026. Virginia resumes participation in RGGI.
Aug. 19, 2026. California-Québec Joint Auction 48 settles at $32.48 a metric ton.
Sept. 2, 2026. Washington Cap-and-Invest Auction 15 settles at $39.50.
Sept. 9, 2026. RGGI Auction 73 clears at $37.65 per short ton.
Nov. 20, 2026. The UK and EU announce that linking negotiations are concluded, with a target of Jan. 1, 2028, subject to ratification.
Jan. 1, 2027. The UK CBAM is planned to begin; London intends to exempt goods from the EU, the EEA, and Switzerland from that date.
Jan. 1, 2028. Planned start of the UK-EU allowance link. London expects the EU CBAM exemption for originating UK goods from this date, if the EU completes the Annex III step.
Caveats and Criticism
The 2022 gas-price shock remains a central driver of European industrial distress, and it is not a carbon-market event. EUROFER noted that the benchmark TTF gas price had exceeded €50 per megawatt-hour in March 2026.
Washington’s low industrial rate is a reminder that hydroelectric resources and market structure can outweigh a carbon cap. The DESNZ and EIA figures use different bands, currencies, and tax treatments, and RGGI allowances are short tons, not metric tons. Reuters, citing the UK government, put UK exports facing the EU levy at £7 billion; the official UK figure used above is £6.5 billion. Energy UK treated £800 million as annual; it is not in the Nov. 20 statement. New York’s economy-wide cap-and-invest program is not operating. Industry closure totals are announced capacities from trade associations.
Stu’s Take
I will not pretend that linking two expensive systems is the same thing as making energy abundant at home. Britain and the EU just agreed to share a carbon market and, if the legal steps follow, to stop taxing each other’s steel at the border. That is tidier trade policy. It does not cut the industrial power prices already in the official tables, and it does not reopen a chemical plant that has already been scheduled for closure. In my view, carbon-market states and countries tend to carry higher energy costs for factories and households. Energy security starts at home, with firm generation, reliable fuels, and a clear-eyed look at the policies that travel with a carbon price — renewable mandates, fuel standards, and vehicle rules included. If we want factories and the jobs that come with them, we should measure every climate policy against the power bill and the production line, not only against the allowance ticker.
Carbon markets do not reduce carbon, they just transfer wealth.
Sources
Primary and official documents used in this article, with access dates. Quotations and price prints attributed to Reuters are from its Nov. 20, 2026, explainer by Susanna Twidale, edited by Kevin Liffey, on Reuters.com.
- European Commission, Directorate-General for Climate Action, “Negotiations finalised to link EU and UK Emissions Trading Systems,” Nov. 20, 2026. Accessed Nov. 21, 2026. https://climate.ec.europa.eu/news-other-reads/news/negotiations-finalised-link-eu-and-uk-emissions-trading-systems-2026-11-20_en
- European Commission, Directorate-General for Taxation and Customs Union, “EU and UK agree to link Emission Trading Systems (ETS),” Nov. 20, 2026. Accessed Nov. 21, 2026. https://taxation-customs.ec.europa.eu/news/eu-and-uk-agree-link-emission-trading-systems-ets-2026-11-20_en
- UK government, “UK-EU ETS linking agreement: explainer,” published Nov. 20, 2026. Accessed Nov. 21, 2026. https://www.gov.uk/government/publications/uk-eu-linking-agreement-explainer/uk-eu-linking-agreement-explainer
- UK government, “UK-EU Summit 2026 Explainer ETS Linking (HTML).” Accessed Nov. 21, 2026. https://www.gov.uk/government/publications/ukeu-summit-2026-key-documents/uk-eu-summit-2026-explainer-ets-linking-html
- Reuters, Susanna Twidale, “Explainer-What are the UK and EU carbon markets and what does linking them mean?” London, Nov. 20, 2026; edited by Kevin Liffey. Accessed Nov. 21, 2026. https://www.reuters.com/business/environment/what-are-uk-eu-carbon-markets-what-does-linking-them-mean-2026-11-20/
- Euronext Live syndicated copy of the same Reuters explainer, Nov. 20, 2026. Accessed Nov. 21, 2026. https://live.euronext.com/en/financial-news/explainer-what-are-uk-and-eu-carbon-markets-and-what-does-linking-them-mean
- Energy UK, “Energy UK welcomes ambitious UK-EU agreement on energy and climate cooperation,” Nov. 20, 2026, including remarks by Dhara Vyas. Accessed Nov. 21, 2026. https://www.energy-uk.org.uk/news/energy-uk-welcomes-ambitious-uk-eu-agreement-on-energy-and-climate-cooperation/
- UK Parliament written answer UIN 104924, tabled Jan. 12, 2026, answered Jan. 15, 2026 by Chris McDonald, stating that the £800 million estimate is from a Frontier Economics report and refers to cumulative savings between 2026 and 2030. Accessed Nov. 21, 2026. https://questions-statements.parliament.uk/written-questions/detail/2026-01-12/104924/
- HM Treasury, Written Statement HCWS1519, Carbon Price Support, Dan Tomlinson, April 16, 2026. Accessed Nov. 21, 2026. https://questions-statements.parliament.uk/written-statements/detail/2026-04-16/hcws1519
- HM Revenue & Customs, “Climate Change Levy rates,” updated Nov. 17, 2026. Accessed Nov. 21, 2026. https://www.gov.uk/guidance/climate-change-levy-rates
- California Air Resources Board and Québec MELCCFP, August 2026 Joint Auction #48 Summary Results Report, auction held Aug. 19, 2026, report dated Aug. 26, 2026. Current-auction settlement price $32.48. Accessed Nov. 21, 2026. https://ww2.arb.ca.gov/sites/default/files/2026-08/nc-aug_2026_summary_results_report.pdf
- California Assembly Bill 1207, chaptered Sept. 19, 2025; legislative intent that the mechanism be known as the California Cap-and-Invest Program; provisions extended until Jan. 1, 2046 (program through Dec. 31, 2045). Accessed Nov. 21, 2026. https://leginfo.legislature.ca.gov/faces/billTextClient.xhtml?bill_id=202520260AB1207
- Office of Governor Gavin Newsom, bill-signing release, Sept. 19, 2025. Accessed Nov. 21, 2026. https://www.gov.ca.gov/2025/09/19/governor-newsom-signs-historic-package-of-bipartisan-legislation-saving-billions-on-electric-bills-stabilizing-gas-market-and-cutting-pollution/
- Washington Department of Ecology, Cap-and-Invest Program Auction #15 September 2026 Summary Report, auction held Sept. 2, 2026, issued Sept. 9, 2026, publication no. 26-14-063. Settlement price $39.50. Accessed Nov. 21, 2026. https://apps.ecology.wa.gov/publications/documents/2614063.pdf
- Washington Department of Ecology, Cap-and-Invest linkage page. Accessed Nov. 21, 2026. https://www.ecology.wa.gov/air-climate/climate-commitment-act/cap-and-invest/linkage
- RGGI, Inc., Allowance Prices and Volumes, Auction 73, Sept. 9, 2026, clearing price $37.65. Accessed Nov. 21, 2026. https://www.rggi.org/auctions/auction-results/prices-volumes
- RGGI, Inc., press release, “CO2 Allowances Sold for $37.65 in 73rd RGGI Auction,” Sept. 11, 2026. Accessed Nov. 21, 2026. https://www.rggi.org/sites/default/files/Uploads/Auction-Materials/73/PR091126_Auction73.pdf
- RGGI, Inc., Auction Notice for Auction 73, July 14, 2026, listing participating states and stating that as of Nov. 12, 2025, Pennsylvania is no longer a Participating State. Accessed Nov. 21, 2026. https://www.rggi.org/sites/default/files/Uploads/Auction-Materials/73/Auction_Notice_Jul_14_2026.pdf
- New York State, Cap-and-Invest program site, describing DEC and NYSERDA as designing the program. Accessed Nov. 21, 2026. https://capandinvest.ny.gov/
- New York Environmental Conservation Law § 75-0109, as revised May 29, 2026, including § 75-0109(1) (Dec. 31, 2028, deadline) and § 75-0109(3)(f)(i) (cap-and-invest and linkage language). Accessed Nov. 21, 2026. https://www.nysenate.gov/legislation/laws/ENV/75-0109
- California Air Resources Board, Low Carbon Fuel Standard program page. Accessed Nov. 21, 2026. https://ww2.arb.ca.gov/our-work/programs/low-carbon-fuel-standard
- California Air Resources Board, California Climate Investments (auction-proceeds program). Accessed Nov. 21, 2026. https://ww2.arb.ca.gov/our-work/programs/california-climate-investments
- RGGI, Inc., Investments of RGGI Proceeds. Accessed Nov. 21, 2026. https://www.rggi.org/investments/proceeds-investments
- Oregon Department of Environmental Quality, Climate Protection Program. Accessed Nov. 21, 2026. https://www.oregon.gov/deq/ghgp/cpp/pages/default.aspx
- Trade and Cooperation Agreement between the EU and the United Kingdom, Article 392 (carbon pricing). Official Journal L 149, April 30, 2021. Accessed Nov. 21, 2026. https://eur-lex.europa.eu/eli/agree_internation/2021/689%281%29/oj/eng
- Department for Energy Security and Net Zero, international non-domestic electricity prices, Table 5.4.3, publication date May 28, 2026, data for July–December 2025. Accessed Nov. 21, 2026. https://www.gov.uk/government/statistical-data-sets/international-non-domestic-energy-prices
- DESNZ Table 5.4.3 workbook (table_541.xlsx). Accessed Nov. 21, 2026. https://assets.publishing.service.gov.uk/media/6a1565099819be865f421cda/table_541.xlsx
- DESNZ, Quarterly Energy Prices, September 2026, statistical release Sept. 29, 2026, data for April–June 2026, including the 17.4 pence per kWh manufacturing average. Accessed Nov. 21, 2026. https://assets.publishing.service.gov.uk/media/6aba2810fe72ed1e2b02f0e7/Quarterly_Energy_Prices_September_2026.pdf
- Eurostat, “Non-household electricity prices fall further in 2026,” Nov. 4, 2026, EU average €0.18/kWh in the first half of 2026 for the 500–2,000 MWh band. Accessed Nov. 21, 2026. https://ec.europa.eu/eurostat/web/products-eurostat-news/w/ddn-20261104-1
- U.S. Energy Information Administration, Electric Power Monthly, Table 5.6.A, data for August 2026, released Oct. 23, 2026. Accessed Nov. 21, 2026. https://www.eia.gov/electricity/monthly/epm_table_grapher.php?t=epmt_5_6_a
- Cefic, Chemical Trends Report, October 2025 (Q3 2025), EU27 chemicals output −2.5% in January–September 2025. Accessed Nov. 21, 2026. https://cefic.org/app/uploads/2025/11/Chemical-Trends-Report-Q3-2025.pdf
- Roland Berger for Cefic, “European chemical closures and investments radar 2022-2025,” December 2025, announcements from Jan. 1, 2022, through Dec. 8, 2025. Accessed Nov. 21, 2026. https://cefic.org/app/uploads/2026/01/European-Chemical-Closures-and-Investments-Radar-2022-2025.pdf
- EUROFER, “New report: European steel production hits historic low as imports gain record share of EU market,” March 16, 2026. Accessed Nov. 21, 2026. https://www.eurofer.eu/assets/press-releases/new-report-european-steel-production-hits-historic-low-as-imports-gain-record-share-of-eu-market/20260313-New-report_European-steel-production-hits-historic-low.pdf
- Tata Steel UK, “Closure of Blast Furnace 4 but green steel project will ensure next generation of steelmaking.” Accessed Nov. 21, 2026. https://www.tatasteeluk.com/corporate/news/closure-of-blast-furnace-4-but-green-steel-project-will-ensure-next-generation-of-steelmaking
- Public Law 119-16, H.J. Res. 88, approved June 12, 2025, disapproving the EPA Advanced Clean Cars II waiver, which “shall have no force or effect.” Accessed Nov. 21, 2026. https://www.govinfo.gov/content/pkg/PLAW-119publ16/pdf/PLAW-119publ16.pdf
- Congress.gov, H.J.Res.88, 119th Congress, all information. Accessed Nov. 21, 2026. https://www.congress.gov/bill/119th-congress/house-joint-resolution/88/all-info
- YouGov / Eurotrack, Climate Change survey results, fieldwork April 7–23, 2026, sample 2,151 adults in Great Britain and comparable samples in France, Germany, Denmark, Spain, and Italy. Accessed Nov. 21, 2026. https://d3nkl3psvxxpe9.cloudfront.net/documents/Eurotrack_ClimateChange_Apr26_w.pdf
Key Excerpts
European Commission, Climate Action, Nov. 20, 2026. “The parties have committed to applying this agreement as of 1 January 2028, subject to the ratification process and entry into force in the EU and UK. The intention to link the two systems was announced at the first EU-UK Summit in May 2025.” The UK “will expand its ETS, including for aviation and maritime. As a result, over 10 million tonnes of additional CO2 emissions will be included in the system.” “The EU ETS has been linked with Switzerland’s ETS since 1 January 2020. This link will remain in place.”
European Commission, Taxation and Customs Union, Nov. 20, 2026. “The conclusion of negotiations for an agreement to link the EU’s and UK’s respective Emission Trading Systems (ETS) … paves the ground for a possible future mutual exemption from the partners’ respective Carbon Border Adjustment Mechanisms.” “On the EU side, Annex III of EU CBAM Regulation will need to be amended through a delegated act under Article 2(11) of the CBAM Regulation.” “The Commission stands ready to launch these procedures as soon as possible.”
UK government explainer, Nov. 20, 2026. “The UK and EU are aiming for the link to become operational on 1 January 2028. From this point ETS allowances issued in either the UK or EU can be used for compliance purposes across either scheme. This includes compliance with surrender obligations for emissions produced during the 2027 scheme year.” The agreement “will support UK economic growth, adding up to £3.8 billion to the UK economy each year by 2040, and reduce costs for UK businesses by creating the conditions for an exemption from the EU CBAM for £6.5 billion worth of UK exports.” “The UK government intends to exempt goods originating in the EU, EEA and Switzerland from the UK CBAM from 1 January 2027.” “The EU CBAM exemption is expected to apply from 1 January 2028. This is subject to EU legislative procedures, which they will launch without delay.”
Reuters, Susanna Twidale, Nov. 20, 2026, Reuters.com. “The benchmark EU carbon contract is currently trading around €82 ($90) per metric ton while the UK contract is currently around £60/ton ($79).” “The UK government has said the EU levy currently applies to £7 billion ($9 billion) worth of UK exports to the bloc.” “Energy UK said the measure could save UK industry around £800 million a year.” “Opposition Conservative leader Kemi Badenoch … has argued the carbon levies have harmed Britain’s industries and wants to remove them completely.” “British fossil fuel power generators also currently pay an extra £18/ton carbon tax on top of their ETS obligations, which the government has signalled will end in April 2028.” Exchange rates in the same copy: “$1 = 0.9108 euros” and “$1 = 0.7630 pounds.”
Dhara Vyas, Energy UK, Nov. 20, 2026. “Today’s agreement is a real milestone. Linking our carbon markets is good for consumers, good for investment, and good for the climate.” “Linking our respective carbon pricing regimes will strengthen industrial competitiveness and enable faster and more cost-effective decarbonisation.”
HM Treasury written statement, April 16, 2026. “I am today confirming to the House that Carbon Price Support (CPS) will be removed from April 2028.” “Coal has been driven off the grid and the ETS has matured … so now is the right time to simplify the tax and carbon pricing system.”
Public Law 119-16, approved June 12, 2025. Congress disapproved the EPA rule relating to “California State Motor Vehicle and Engine Pollution Control Standards; Advanced Clean Cars II; Waiver of Preemption; Notice of Decision” (90 Fed. Reg. 642 (January 6, 2025)), “and such rule shall have no force or effect.”
Cefic / Roland Berger radar, December 2025. “Between 2022 and 2025YTD, announced closures in the European chemical industry increased sixfold from 2.9 Mt to 17.2 Mt per year, and doubled between 2024-25YTD, totaling 37 Mt in 2022-25YTD and representing ~9% of the European chemical production capacity.” “Considering both announced closures and confirmed investments over 2022-25YTD, there is a growing asymmetry potentially leading to a net capacity reduction of -30.2 Mt,” including Germany (−8.0 Mt), the Netherlands (−6.9 Mt), the United Kingdom (−4.2 Mt), and France (−3.5 Mt).
EUROFER press release, March 16, 2026. EU steel production fell “to a historic low of around 125.8 million tonnes in 2025,” and “the share of imports in EU steel consumption [reached] a record 29% in the third quarter of 2025.” “The benchmark TTF gas price exceeded €50/MWh in March 2026.”
Data Tables
Figures used in the article and charts, with as-of dates. All values were checked against the sources listed above. As of 4:16 p.m. Central Time, Saturday, Nov. 21, 2026
Table A. Carbon allowance prices used in Chart 1
| Market | Unit as published | USD per metric ton | Date and type | |
| EU allowance (EUA) | Around €82 ($90) | € / metric ton | About 90 | Nov. 20, 2026, Reuters market print |
| UK allowance (UKA) | Around £60 ($79) | £ / metric ton | About 79 | Nov. 20, 2026, Reuters market print |
| California–Québec | $32.48 | USD / metric ton | 32.48 | Aug. 19, 2026, Joint Auction 48 settlement |
| Washington | $39.50 | USD / metric ton | 39.50 | Sept. 2, 2026, Auction 15 settlement |
| RGGI | $37.65 | USD / short ton | 41.50 | Sept. 9, 2026, Auction 73 clearing price, converted ÷ 0.907185 |
Reuters conversions use the explainer’s own rates ($1 = €0.9108; $1 = £0.7630). RGGI is a short-ton allowance; the metric-ton column is a conversion for comparison only. EU and UK figures are market prints, not official auction settlements. California’s Nov. 18, 2026, joint auction results were not yet posted when this table was compiled.
Table B. Large non-domestic electricity prices, second half of 2025 (DESNZ Table 5.4.3, including levies)
| Jurisdiction | Pence per kWh |
| United Kingdom | 23.37 |
| Ireland | 17.16 |
| Italy | 14.31 |
| Germany | 13.89 |
| EU-27 plus UK median | 11.39 |
| Netherlands | 10.16 |
| Spain | 9.45 |
| France | 7.43 |
| Finland | 4.36 |
| UK relative to the EU-27-plus-UK median | 105.2% higher |
Large consumers: 20,000–69,999 MWh a year. Prices include environmental and social levies and exclude recoverable taxes such as VAT. Publication date May 28, 2026; derived from Eurostat. The Netherlands figure is in this table; it was omitted from Chart 2 only to prevent a label overlap. DESNZ also reports a UK manufacturing average of 17.4 pence per kWh in the second quarter of 2026 (Quarterly Energy Prices, September 2026).
Table C. U.S. industrial electricity prices, August 2026 (EIA Table 5.6.A)
| Jurisdiction | Cents per kWh | State carbon-market status |
| California | 24.12 | Cap-and-Invest, linked with Québec |
| Massachusetts | 20.03 | RGGI |
| New York | 10.54 | RGGI; economy-wide cap-and-invest not operating |
| U.S. average | 9.64 | No federal cap-and-trade program |
| Oregon | 8.75 | Climate Protection Program (fuel-supplier cap) |
| Washington | 7.43 | Cap-and-Invest; CA/QC link signed June 2026, shared market expected 2027 |
| Texas | 7.21 | No state carbon market |
| Tennessee | 6.92 | No state carbon market |
| Louisiana | 6.10 | No state carbon market |
Average price of electricity to ultimate customers, industrial sector. Data for August 2026, released Oct. 23, 2026. 2026 values are preliminary. Tennessee and Louisiana appear here for comparison; they are not in Chart 3.
Table D. RGGI participating states as of Auction 73
| State | Status |
| Connecticut, Delaware, Maine, Maryland, Massachusetts, New Hampshire, New Jersey, New York, Rhode Island, Vermont | Participating |
| Virginia | Resumed participation July 1, 2026 |
| Pennsylvania | No longer a participating state as of Nov. 12, 2025; never an active auction participant |
Source: RGGI Auction Notice for Auction 73, July 14, 2026, and the Sept. 11, 2026, auction press release.
Table E. Industry output and announced-capacity figures
| Item | Figure | Source and date |
| EU27 chemical output, Jan.–Sept. 2025 vs. 2024 | −2.5% | Cefic Chemical Trends Report, October 2025 |
| EU27 chemical output vs. pre-crisis level | 10% below | Cefic Chemical Trends Report, October 2025 |
| Announced European chemical capacity closures, 2022–Dec. 8, 2025 | 37 million tonnes (~9% of capacity) | Roland Berger for Cefic, December 2025 |
| Of which announced in 2025 year-to-date | 17.2 million tonnes (vs. 2.9 million tonnes in 2022) | Same radar report |
| Potential net capacity reduction after confirmed investments | 30.2 million tonnes | Same radar report |
| Of which Germany / Netherlands / UK / France | −8.0 / −6.9 / −4.2 / −3.5 million tonnes | Same radar report |
| EU steel production, 2025 | About 125.8 million tonnes, a historic low | EUROFER, March 16, 2026 |
| Imports’ share of EU steel consumption, Q3 2025 | 29%, a record | EUROFER, March 16, 2026 |
Cefic and EUROFER are trade associations. Closure totals are announced capacities, not a government census of completed shutdowns. Tata Steel’s Port Talbot blast-furnace closure in 2024 is described by the company as part of a transition to electric-arc-furnace steelmaking.
Table F. YouGov Eurotrack, April 7–23, 2026, share supporting “Taxes for companies who produce substantial carbon emissions”
| Country | Sample (unweighted) | Total support (April 2026 column) |
| Great Britain | 2,151 | 74% |
| France | 1,008 | 74% |
| Spain | 1,050 | 76% |
| Italy | 1,043 | 72% |
| Germany | 2,352 | 64% |
| Denmark | 1,030 | 63% |
| Great Britain, support for increasing fuel duty | 2,151 | 18% |
The published tables have two columns per country. The April 2026 wave is the second column, which matches the stated sample size (2,151 adults in GB). Fieldwork April 7–23, 2026. The body uses the British figures; the other countries are shown here for context.
Background
The EU Emissions Trading System, launched in 2005, is a cap-and-trade market now in its fourth phase (2021–2030). It also covers Iceland, Liechtenstein, and Norway, and it applies to electricity generation in Northern Ireland under the Brexit arrangements. A Reuters explainer of Nov. 20, 2026, said the EU scheme covers around 40 percent of EU emissions and the UK scheme around 25 percent of Britain’s. Those are Reuters’ estimates. The EU ETS has been linked with Switzerland’s system since Jan. 1, 2020. The UK opened its own ETS in 2021 after leaving the EU system at the end of 2020. The Trade and Cooperation Agreement committed the UK and EU to cooperate on carbon pricing and to give serious consideration to linking (Article 392). California’s cap-and-trade market, now designated Cap-and-Invest under AB 1207, has been linked with Québec for years. Washington signed an agreement in June 2026 to link with California and Québec, and expects a shared market in 2027. RGGI, launched with auctions in 2008, is a power-sector program. Virginia left and later returned; Pennsylvania was directed toward membership, was held out of auctions by litigation, and as of Nov. 12, 2025, is no longer a participating state, after the 2025–26 budget law (Act 45) repealed its RGGI rule. New York’s 2026–27 budget amended the state climate law to require DEC to adopt greenhouse-gas regulations by Dec. 31, 2028 (Environmental Conservation Law § 75-0109(1)), and to consider “a market-based economy-wide cap-and-invest program that could be linked to other jurisdictions” (Environmental Conservation Law § 75-0109(3)(f)(i)).
Methodology
This article was reported on Nov. 21, 2026, against official UK, EU, California, Washington, RGGI, EIA, and UK statistical documents, plus trade-association reports from Cefic and EUROFER and a YouGov Eurotrack survey. Quotations and price prints attributed to Reuters are from its Nov. 20, 2026, explainer by Susanna Twidale, edited by Kevin Liffey, on Reuters.com. Where Reuters and official documents differ — notably Reuters, citing the UK government, putting exports facing the EU levy at £7 billion versus the official UK figure of £6.5 billion, and Reuters’ Energy UK “£800 million a year” line, which the UK government has said is a cumulative 2026–2030 Frontier Economics estimate — both figures are labeled in the article.
Carbon prices in Chart 1 are shown in dollars per metric ton for comparison. EU and UK values are Reuters’ Nov. 20 market prints, converted at the rates in that explainer. California, Washington, and RGGI values are official 2026 auction settlements; the RGGI short-ton price is converted by dividing by 0.907185. Industrial electricity prices are presented in their native units, pence per kilowatt-hour for the DESNZ table and cents per kilowatt-hour for EIA Table 5.6.A, and are not combined into a single converted ranking.
As of 4:16 p.m. Central Time, Saturday, Nov. 21, 2026