West Texas Intermediate is trading near $101 a barrel. National gasoline is $4.44 a gallon. Those are the conditions that usually refill rig lines and permit queues. In Colorado, they have not.
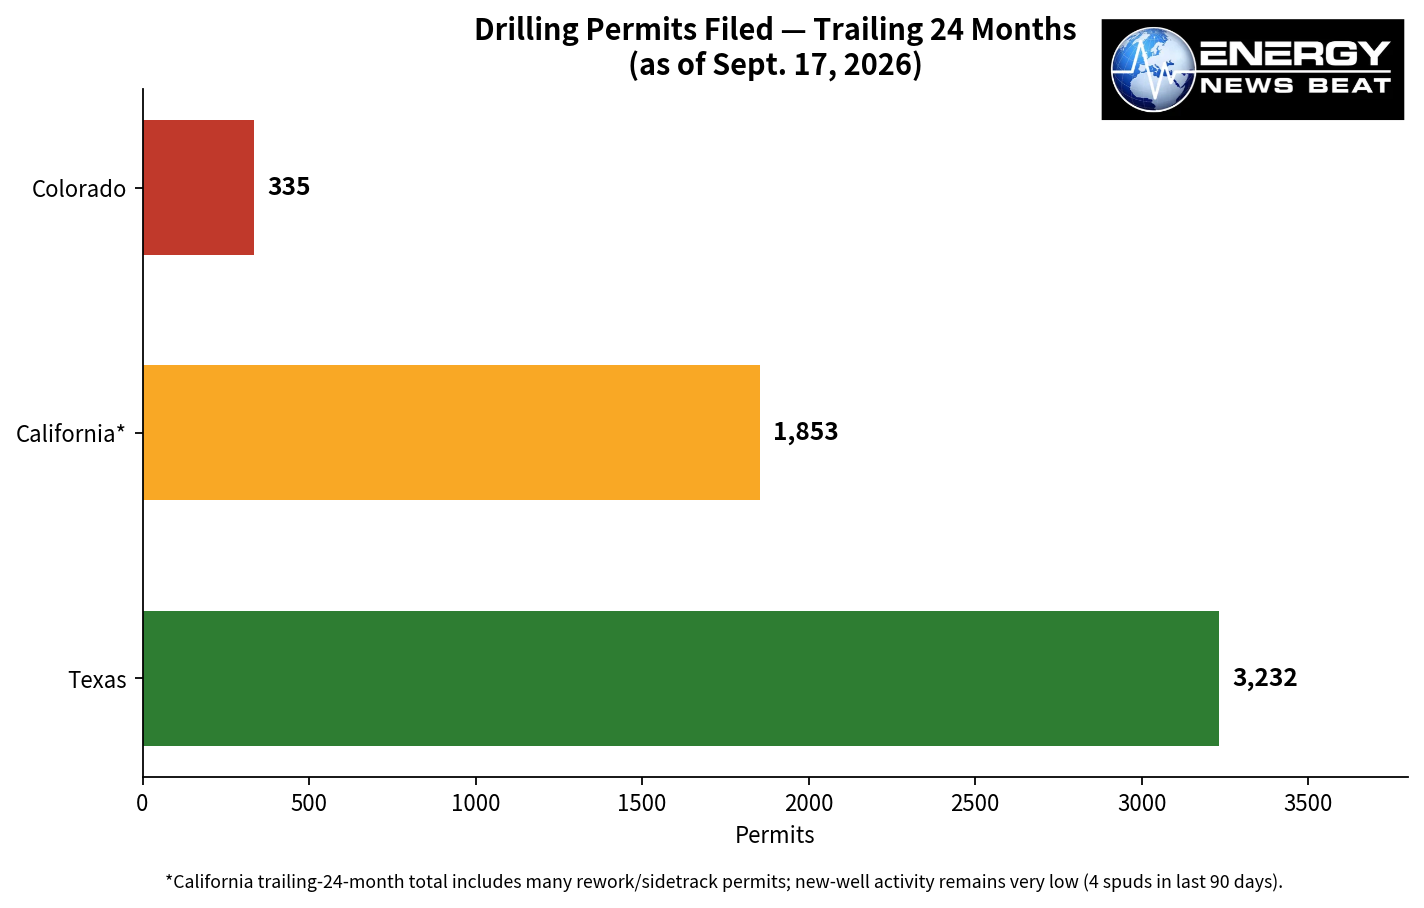
As of September 17, 2026, Colorado operators had filed only 335 drilling permits over the trailing 24 months. In the last 90 days, they spudded 138 wells and brought 103 wells onto first production in the last six months. The drilled-but-uncompleted inventory sits at 759 wells. That is a thin pipeline for a state that still ranks among the nation’s top 10 oil and gas producers.
The Denver Business Journal’s September 9 report captured the same mismatch: new well starts are lagging even as crude prices stay high. Related state reporting earlier this year showed Colorado plugged more wells than it drilled in 2025, with industry officials pointing to permit timelines of 230 to 250 days as the reason operators have grown more selective.
The longer record is more revealing than any single month.
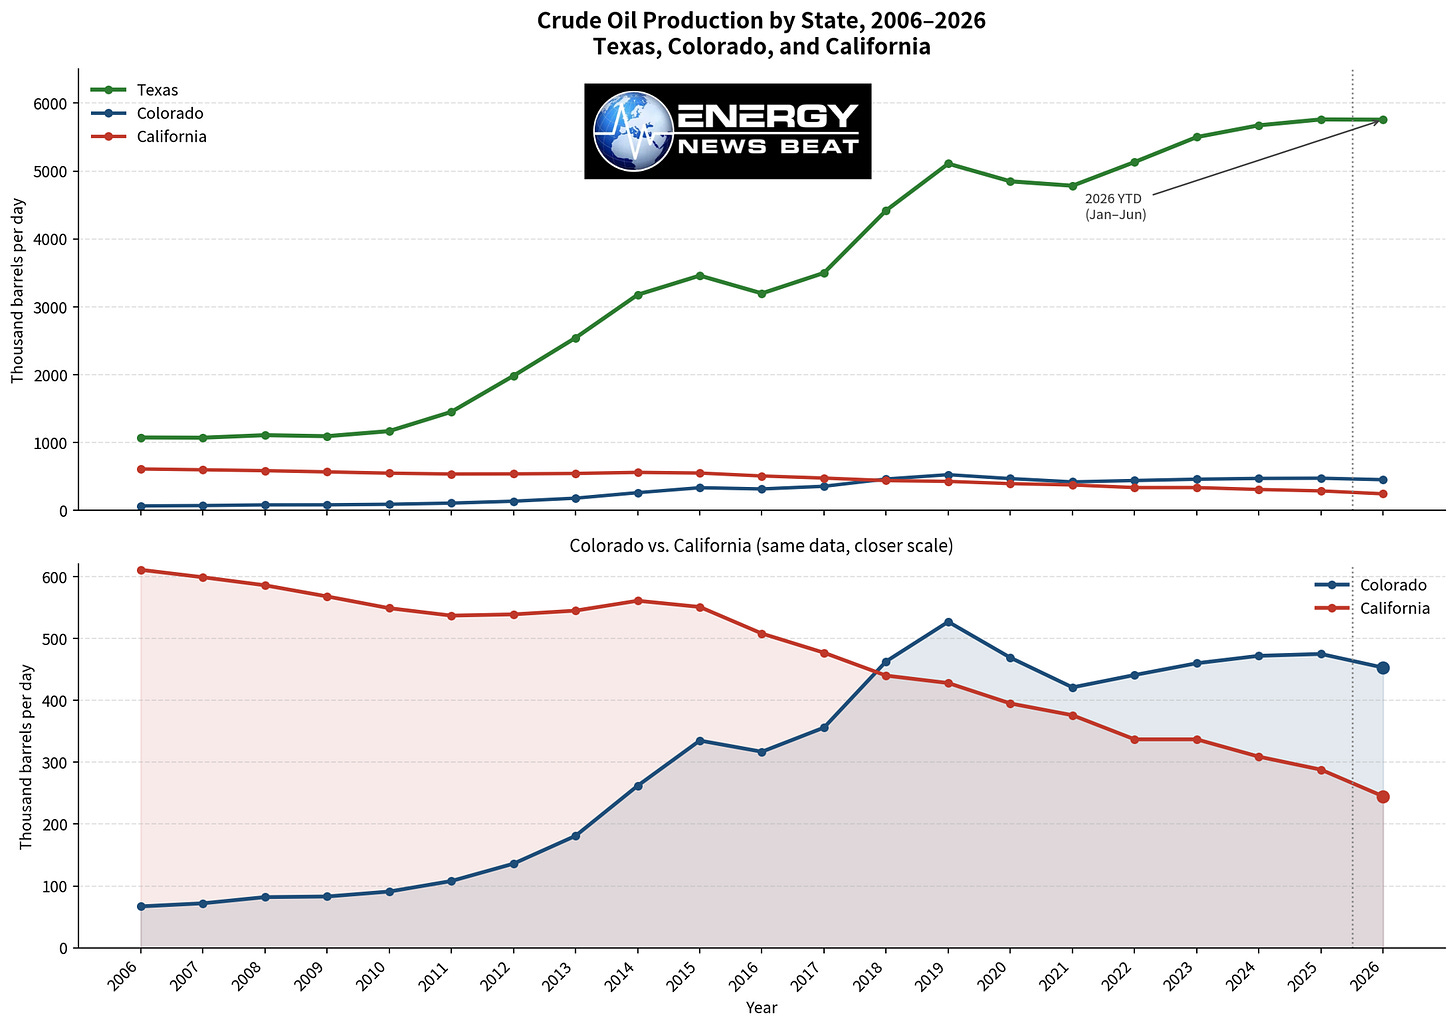
Oil Production between Texas, Colorado and California
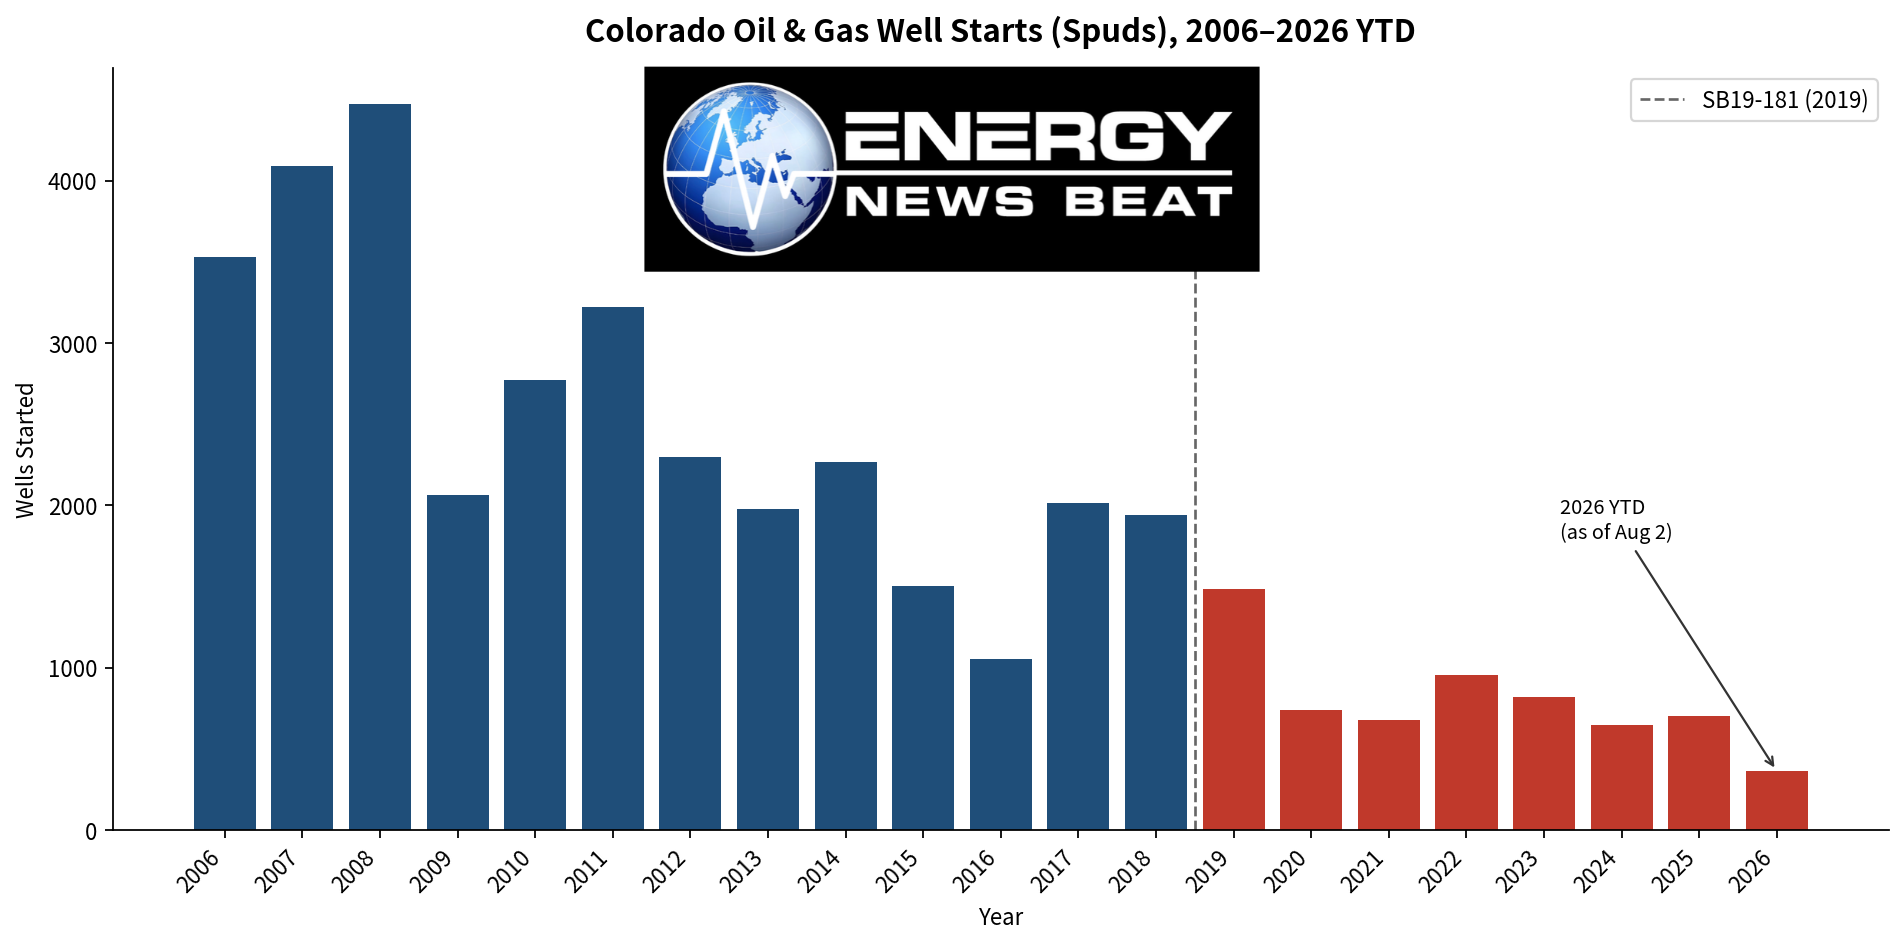
Twenty years of Colorado well starts: boom, then a structural drop
Colorado Energy & Carbon Management Commission (ECMC) well-start data show the state’s last true drilling boom ended more than a decade ago. Statewide well starts peaked at 4,470 in 2008, stayed above 2,000 through most of the Niobrara ramp, then collapsed with the 2015–16 price crash. They recovered into the late 2010s, then fell again after Senate Bill 19-181 and never rebuilt to pre-2019 levels.
|
Year
|
Well starts
|
Year
|
Well starts
|
|---|---|---|---|
|
2006
|
3,532
|
2017
|
2,015
|
|
2008
|
4,470
|
2018
|
1,941
|
|
2011
|
3,220
|
2019
|
1,488
|
|
2014
|
2,265
|
2020
|
742
|
|
2015
|
1,504
|
2022
|
954
|
|
2016
|
1,057
|
2024
|
647
|
|
2025
|
704
|
||
|
2026 YTD (Aug. 2)
|
363
|
2026 year-to-date through early August was 363 — already a pace that would finish well below the mid-2010s, even if activity accelerated in the fourth quarter.
Permit approvals tell the same story with a sharper break. A state report cited by The Denver Post found 14,937 well permits approved from 2015–18, versus 3,980 from 2022–25. Oil and gas locations approved within 2,000 feet of residences fell 88 percent, from 719 to 87, over those same windows.
The 2025 Cumulative Impacts report from ECMC is consistent with that slowdown. The commission approved 48 Oil and Gas Development Plans in 2025, down about 20 percent from 58 in 2024. Those plans covered 801 wells, a 30 percent drop from 2024. Operators commenced drilling on 775 wells in 2025 and plugged 1,383, for a net reduction of 608 active wells. No OGDPs were submitted between December 13, 2024, and February 20, 2025, after new cumulative-impacts and environmental-social-performance rules took effect. Only four of the 48 approved plans were filed under the new rules.
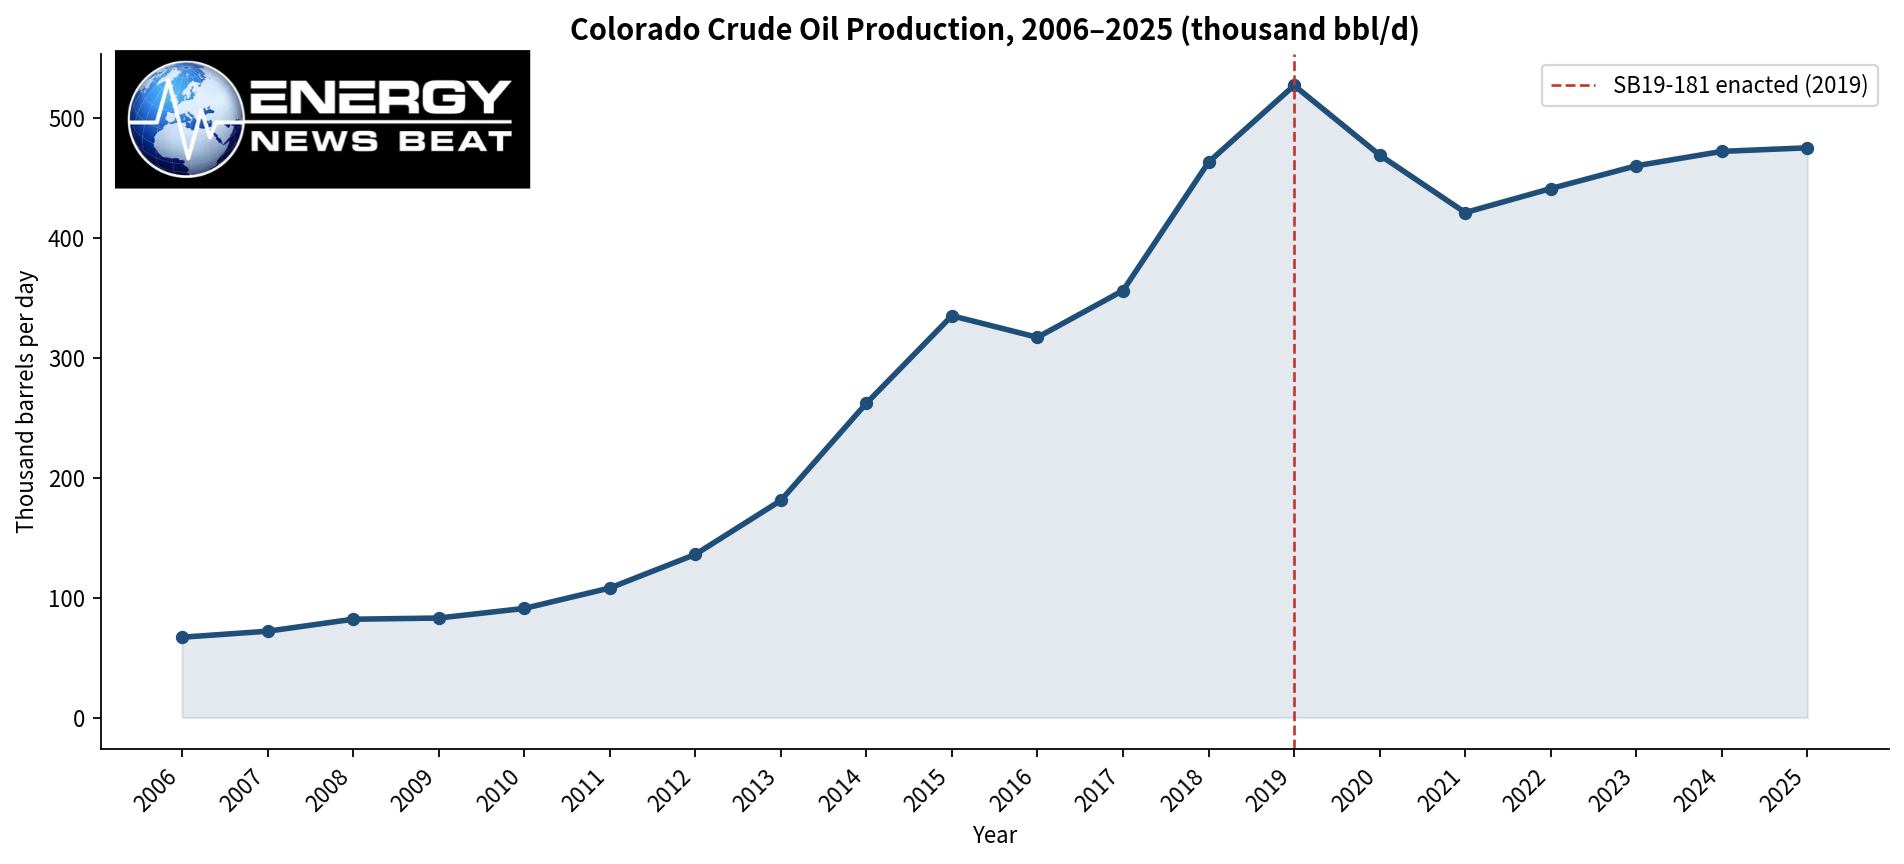
Production has been more resilient than well counts because laterals got longer and remaining inventory is high-quality. EIA annual data show Colorado crude output rising from 67,000 barrels per day in 2006 to a peak of 527,000 b/d in 2019, then settling in a 421,000–475,000 b/d range from 2021 through 2025. Output in 2025 was about 475,000 b/d — still large, but no longer growing with the national shale machine. A 2025 Common Sense Institute analysis estimated that if Colorado had kept pace after 2020, the state would have produced 16.6 million additional barrels of oil plus incremental gas, worth about $1.3 billion.
eia.gov
Net-zero rules and the length of the approval line
Colorado’s regulatory stack is no longer a single setback rule. It is a layered climate, air, land-use, and cumulative-impacts regime built on top of SB19-181.SB19-181, enacted in 2019, changed the commission’s statutory mission from fostering development to regulating it to protect public health, safety, the environment, and wildlife. The subsequent 2,000-foot statewide setback from homes, schools, and child-care centers was among the strictest in the country. Local governments received explicit surface-siting authority. Continuous monitoring, methane, and leak-detection rules followed. House Bill 19-1261 and later climate statutes set statewide greenhouse-gas cuts culminating in net-zero by 2050, with oil and gas intensity targets folded into later ECMC and Air Quality Control Commission rules.
That architecture shows up in the clock.
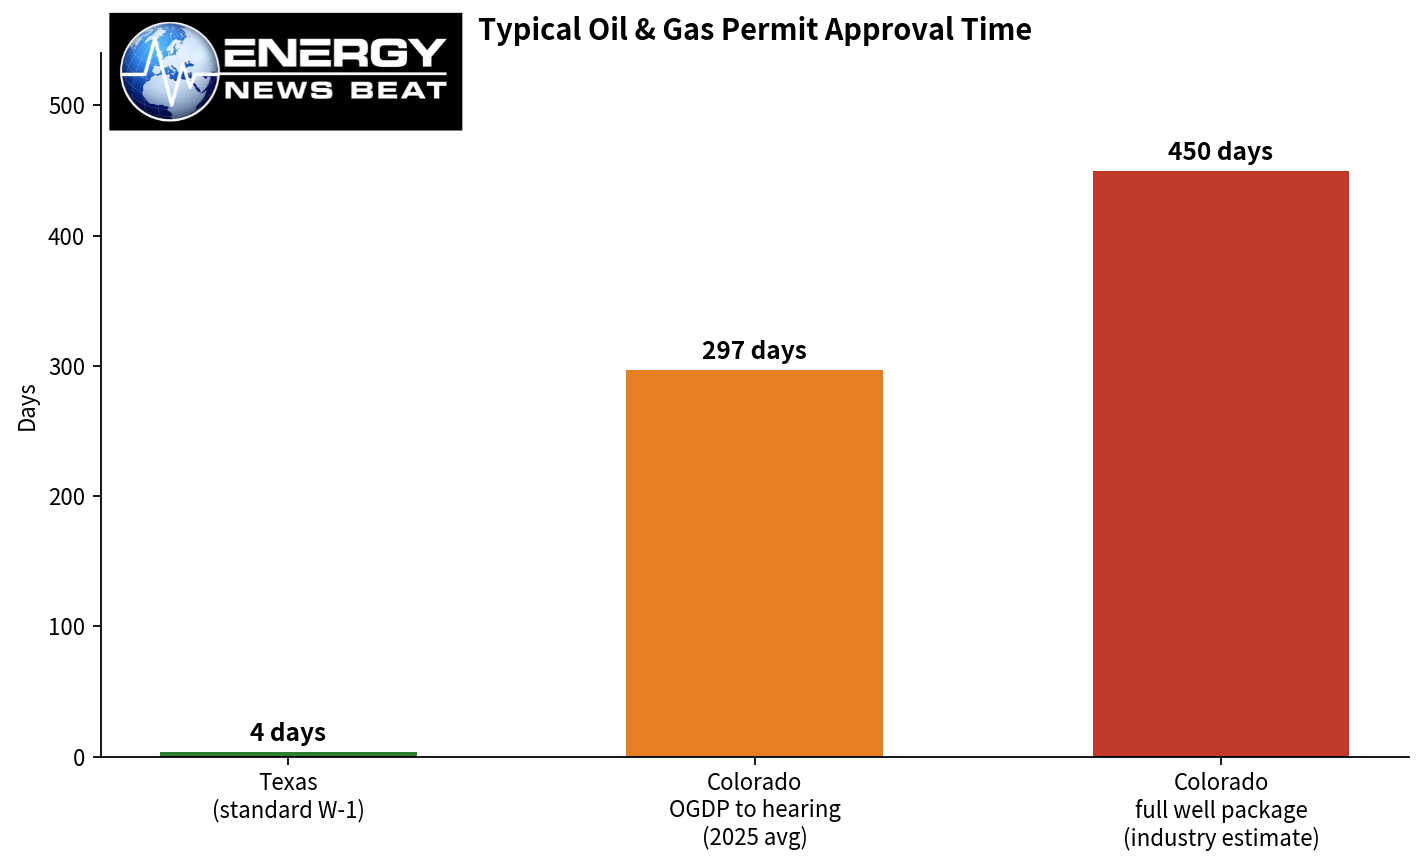
Average time from OGDP submission to hearing: 257 days in 2024 and 297 days in 2025.
Industry estimates for a full package of state and local approvals: 12 to 18 months. Bison Oil and Gas has said that range is now typical.
Weld County local review is often about 90 days; state review is 185 days or longer.
Denver Business Journal reporting put typical permit timelines at 230 to 250 days, enough to make companies “more selective.”
Jeff Robbins, then ECMC chair, acknowledged the delay and tied it to filings that are “10 times more in-depth than they were pre-SB181.” ECMC Director Julie Murphy has argued some of the well-count drop is also technology: fewer, longer laterals can replace a larger number of older wells. Both can be true at once. The process is slower, and each approved location now carries more wells and more paper.
The 2026 rule cycle has not loosened the burden. Colorado moved to end routine flaring and adopted additional Regulation 7 methane revisions aligning with the federal methane rule, including instrument-based leak detection at wellhead-only sites and phase-outs of intentionally emitting equipment. Those rules matter for emissions. They also add cost and schedule risk on every new pad.
Companies are not fleeing the resource. They are shrinking the Colorado bid.
The DJ Basin still has rock. What it has lost is a deep bench of operators willing to run a 20-rig program through a 10-to-18-month permitting gauntlet.
The pattern since 2019 has been consolidation, selective divestiture, and fewer independents, not a sudden emptying of Weld County.
- Chevron bought Noble Energy in 2020 and Denver-based PDC Energy in 2023 for $7.6 billion, becoming Colorado’s largest producer.
- Civitas, itself a roll-up of Bonanza Creek, Extraction, and Crestone Peak, later moved into the Permian and was merged into SM Energy in November 2025.
- Occidental sold DJ Basin mineral assets for $905 million in 2025.
- Chevron explored a sale of DJ midstream assets valued around $2 billion.
Enverus analyst Ryan Hill told The Denver Post that the number of independent companies drilling at least 10 wells a year in the basin fell from 19–20 in 2019 to six in 2025. He said the regulatory environment has weighed on private-equity and public-company appetite for new DJ acquisitions.
Western Midstream’s Colorado oil volumes dropped more than 26 percent since 2019. Weld County officials have pointed to higher operating costs as a driver of midstream ownership changes.
Governor Jared Polis has said major operators have not told him they are pulling production because of state rules, and that oil price is the main driver. Price clearly matters. It does not explain why Colorado well starts remain depressed while WTI is near $100 and Texas is still issuing hundreds of permits a month. The more accurate reading is that the remaining Colorado producers — Chevron, Kerr-McGee/Oxy, SM Energy/Civitas successors, PDC/Noble legacy teams, and a short list of privates such as Bison — are harvesting the best remaining locations and rationing capital against delay.
California over the same 20 years: decline, then a 2026 permitting jolt
California is the closest policy cousin, not the closest geology cousin.CalGEM and watchdog tallies show new-drill permitting was already tight under Governor Jerry Brown and tightened further under Governor Gavin Newsom. Consumer Watchdog and FracTracker report 23,618 new-drill permits from 2011 through 2018, then a much thinner new-well run in the 2020s. New-drill approvals were 25 in 2023, 73 in 2024, and 17 in 2025. First-half 2026 then jumped to 353 new-drill permits, a surge watchdogs attribute to SB 237 streamlining in Kern County. Even then, actual new activity remains anemic: Buckhead Energy’s September 17 snapshot shows 1,853 California permits over 24 months but only 4 wells spudded in the last 90 days. Many of those “permits” are reworks, sidetracks, and steam-flood/EOR work on a century-old well stock, not a new shale factory.
California’s lesson for Colorado is not that every climate rule ends production overnight. California still has more than 200,000 wells on the books and a large Kern County heavy-oil complex. The lesson is that once new-well permitting becomes slow, political, and legally exposed, the drilling fleet leaves and does not quickly return. Colorado is earlier on that curve. Its production has not collapsed. Its new-well machine has.
Texas over the same 20 years: the control group
Texas is the other bookend.
Railroad Commission permit tallies from industry compilations show Texas issuing roughly 10,000 to 30,000 drilling permits a year over the last two decades, with the 2014 peak near 30,000, a COVID trough, and a still-large 2020s run. Recent official and aggregator snapshots put Texas at 812 permits in the last 30 days and 3,232 over the trailing 24 months in Buckhead’s 11-state index — nearly 10 times Colorado’s 335. Texas last-365-day permits in one aggregator file were 7,666. EIA crude production in Texas rose from pandemic levels to 5.76 million b/d in 2025, versus Colorado’s 475,000.
Speed is the policy. RRC staff have processed standard drilling permits in about two days in prior record years and, as of early 2025 public guidance, roughly four business days for standard W-1s and two days for expedited filings. That is not a rounding error against Colorado’s 297-day OGDP-to-hearing average. It is a different theory of the state.
Three states, three energy policies
|
Colorado
|
California
|
Texas
|
|
|---|---|---|---|
|
Statutory posture
|
Regulate to protect health, environment, wildlife; net-zero 2050
|
Phase-down politics + CEQA + local veto, with a 2026 Kern streamlining exception
|
Prevent waste, protect correlative rights, pollute-prevention — development is presumed
|
|
New-well setbacks / siting
|
2,000-ft statewide setback; local surface rules
|
Local land-use + CalGEM + CEQA; dense urban constraints
|
Statewide spacing/density rules; local control far weaker
|
|
Permit clock
|
230–297 days typical; 12–18 months full package
|
CalGEM NOI target 10 working days on paper; CEQA and local review dominate real time
|
2–4 business days for a standard W-1
|
|
Trailing-24-mo permits (Sept. 17, 2026)
|
335
|
1,853 (mostly not new shale drills)
|
3,232
|
|
Last-90-day spuds
|
138
|
4
|
738
|
|
2025 oil output
|
~475,000 b/d
|
declining long-term; ~323,000 b/d range in recent EIA PADD 5 state mix
|
5.76 million b/d
|
|
Industry structure
|
Oligopoly of majors + a handful of independents
|
Majors on old fields (Chevron, Aera, CRC)
|
Deep operator bench across Permian, Eagle Ford, Haynesville
|
Colorado tried to split the difference: keep the resource, raise the environmental bar, and declare a climate destination of net-zero by 2050.
The data say the split is unstable. Production held up better than well counts because the DJ Basin was already drilled into a high-productivity inventory. New capital formation did not. Texas did not make that trade. California made it earlier and is now living with a well stock that is old, expensive, and politically radioactive — which is why consumer prices there are in a different league.
What households actually pay
Energy policy is not only a wellhead story. It shows up on the utility bill and at the pump.
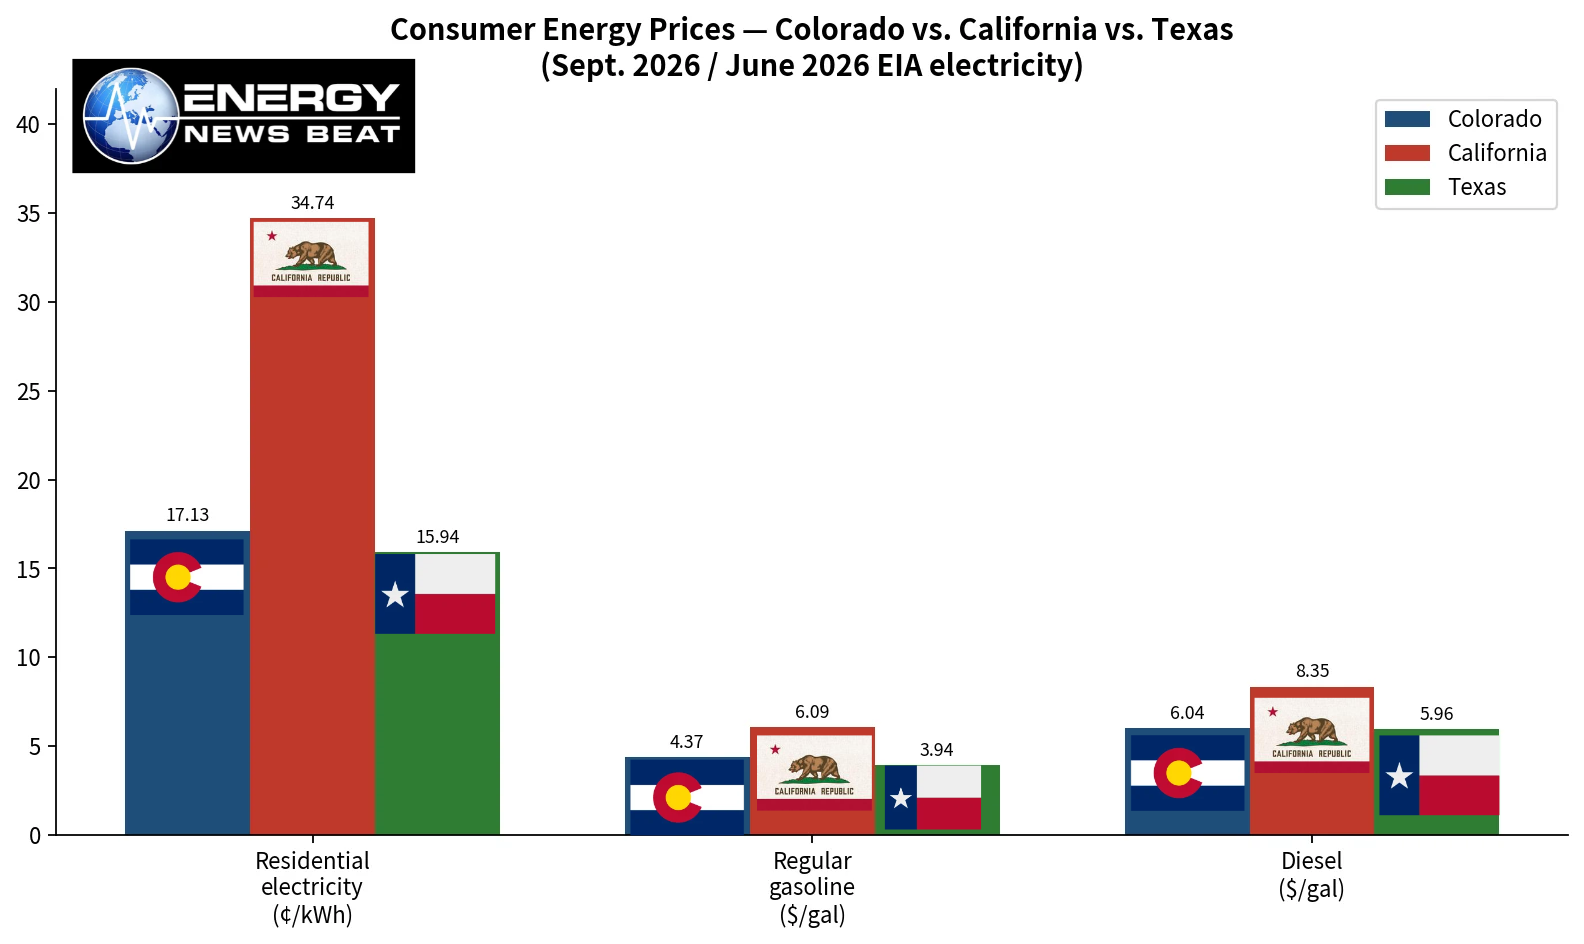
Residential electricity, latest complete EIA month used by rate trackers (June 2026):
- California: 34.74 ¢/kWh
- Colorado: 17.13 ¢/kWh
- Texas: 15.94 ¢/kWh
- U.S. average: 18.34 ¢/kWh
California’s residential rate is roughly double Colorado’s and more than double Texas. Colorado is no longer a cheap-power Mountain West outlier; it is already above Texas and close to the national average.
Regular gasoline, AAA / Gasolytics as of September 17, 2026:
- California: $6.08–$6.09/gal (most expensive state)
- Colorado: $4.37/gal
- Texas: $3.93–$3.94/gal
- U.S. average: $4.44/gal
A Colorado driver is paying about 43 cents less than the national average and about $1.70 less than a California driver, but 40-plus cents more than a Texas driver.
Diesel, September 17, 2026:
- California: $8.35/gal
- Colorado: $6.04/gal
- Texas: $5.96/gal
- U.S. average: $6.40/gal
Diesel is the freight, farm, and construction fuel. Colorado’s diesel price is close to Texas and well below California, which matters for a Front Range logistics economy. The gap with California is not subtle: more than $2 a gallon.
Those retail gaps have more than one cause — fuel taxes, refining constraints, cap-and-trade, renewable-portfolio standards, transmission, and natural-gas basis all matter. The directional pattern still holds. The state with the fastest oil and gas permit system has the cheapest power and the cheapest pump prices of the three. The state with the longest climate-and-land-use obstacle course has the most expensive. Colorado sits in the middle on prices and is moving, on the wellhead side, toward California’s activity profile.
The Bottom Line
High oil prices are supposed to solve a drilling slump. In Colorado, they are not, because the binding constraint is no longer the strip. It is time, process, and political risk.
Well starts that once ran above 3,000 a year are now in the mid-hundreds. Permit approvals are a fraction of the 2015–18 run-rate. Approval clocks measured in days in Texas are measured in three-digit days in Denver. The operator list is shorter. The remaining wells are longer, cleaner, and slower to permit. Production has plateaued rather than crashed, which lets supporters of SB19-181 say the wars are over and lets critics say the next decade’s inventory is being consumed without being replaced.
Compare that with California, where new-well permitting nearly froze and consumer energy costs went vertical, and with Texas, where a two-to-four-day W-1 still feeds a multi-million-barrel-a-day machine. Colorado’s experiment was to be the responsible producer in a net-zero statute. The 20-year record through 2026 year-to-date says the state is still producing. It is no longer replenishing.
Making Appendices Great Again
Check out the World’s Greatest Podcast Show Notes at EnergyNewsBeat.co or EnergyNewsBeat.com.
Appendix: Sources and links
Colorado activity, permits, and well starts
- Denver Business Journal, “Colorado oil and gas well starts lag despite high crude prices,” Sept. 9, 2026: https://www.bizjournals.com/denver/news/2026/09/09/new-oil-natural-gas-wells-decrease-colorado.html
- Denver Business Journal, “More oil and gas wells sealed than drilled in Colorado last year,” May 21, 2026: https://www.bizjournals.com/denver/news/2026/05/21/more-oil-wells-plugged-than-drilled-in-2025.html
- Buckhead Energy, Colorado Drilling Activity Report, Sept. 17, 2026: https://www.buckheadenergy.com/colorado-drilling-activity-report
- Buckhead Energy, Colorado Oil & Gas Industry Snapshot, Sept. 17, 2026: https://www.buckheadenergy.com/colorado-oil-gas-industry-snapshot
- ECMC, Annual Well Starts by County: https://ecmc.state.co.us/cogisdb/ReportTools/PermitActivity/annualWellStarts
- ECMC 2025 Cumulative Impacts Report (executive summary PDF): https://ecmc.colorado.gov/sites/g/files/lrnvjt1211/files/documents/2025-CI-Report-ES-only.pdf
- ECMC permits portals: https://ecmc.state.co.us/permits/?t=1 and https://cogcc.state.co.us/permits/
- OilPriceAPI, Colorado drilling permits: https://www.oilpriceapi.com/data/well-permits/colorado
- Colorado Sun, 2025 emissions and drilling-plan report, May 26, 2026: https://coloradosun.com/2026/05/26/oil-and-gas-emissions-water-recycling-colorado-ecmc-report/
SB19-181, approval times, and industry structure
- The Denver Post, “Did lawmakers end Colorado’s ‘oil and gas wars’?” March 18, 2026: https://www.denverpost.com/2026/03/18/colorao-oil-gas-commission-regulation/
- Colorado General Assembly, SB19-181 materials: https://leg.colorado.gov/ (bill files and fiscal notes)
- CDPHE, methane / Regulation 7 oil and gas rules: https://cdphe.colorado.gov/apcd/reducing-methane-emissions-from-oil-and-gas-operations
- EDF, Colorado routine-flaring rule, Sept. 16, 2026: https://www.edf.org/media/groundbreaking-move-colorado-ends-routine-flaring
- EDF, Regulation 7 inspection revisions, Sept. 16, 2026: https://www.edf.org/media/colorado-strengthens-oil-and-gas-air-quality-regulations-and-clarifies-requirements
Companies, M&A, and capital flight
- Denver Post, Chevron-PDC close, Aug. 8, 2023: https://www.denverpost.com/2023/08/08/chevron-completes-purchase-of-pdc-energy/
- Colorado Sun, Chevron-PDC merger analysis: https://coloradosun.com/2023/05/23/chevron-pdc-energy-merger-oil-gas-colorado/
- Reuters, Chevron DJ midstream sale talks, Oct. 3, 2025: https://www.reuters.com/business/energy/chevron-puts-2-billion-colorado-pipeline-assets-sale-sources-say-2025-10-03/
- Denver Business Journal, Occidental $905 million DJ sale, March 26, 2025: https://www.bizjournals.com/denver/news/2025/03/26/oil-company-sells-mineral-rights-for-905-million.html
- Denver Business Journal, Chevron $2B DJ asset-sale report, Oct. 23, 2025: https://www.bizjournals.com/denver/news/2025/10/23/chevron-2-billion-asset-sale-dj-basin-colorado.html
- Colorado Chamber Foundation, 2025 Relocations Tracker: https://cochamber.com/2026/04/06/new-report-tracks-colorado-company-relocations-lost-opportunities-to-other-states/
Production
- EIA, Colorado field production of crude oil (annual): https://www.eia.gov/dnav/pet/hist/LeafHandler.ashx?n=PET&s=MCRFPCO2&f=A
- EIA, crude oil production by state: https://www.eia.gov/dnav/pet/pet_crd_crpdn_adc_mbblpd_a.htm
- EIA, Colorado field production (thousand barrels): https://www.eia.gov/dnav/peT/hist/LeafHandler.ashx?n=pet&s=mcrfpco1&f=a
California comparison
- CalGEM weekly permits: https://www.conservation.ca.gov/calgem/Pages/permits.aspx
- Consumer Watchdog / FracTracker, 2026 new-drill surge and 2023–25 counts: https://consumerwatchdog.org/energy/california-oil-permits-surge-300-under-new-streamlined-law-watchdogs-warn-of-public-health-and-climate-backlash/
- Buckhead Energy, California Drilling Activity Report, Sept. 17, 2026: https://www.buckheadenergy.com/california-drilling-activity-report
- CalGEM WellSTAR dashboard: https://www.conservation.ca.gov/calgem/Online_Data/Pages/WellSTAR-Data-Dashboard.aspx
Texas comparison
- Texas-Drilling.com, permits approved by year: https://www.texas-drilling.com/drilling-permits
- OilPriceAPI, Texas well permits: https://www.oilpriceapi.com/data/well-permits/texas
- RRC, “Staff Processing Standard Drilling Permits in Two Days”: https://rrc.texas.gov/news/rrc-staff-processing-standard-drilling-permits-in-two-days/
- RRC Oil & Gas Division (current posted processing times): https://rrc.state.tx.us/oil-and-gas/
- Buckhead Energy, U.S. Mineral & Drilling Activity Index, Sept. 17, 2026: https://www.buckheadenergy.com/us-drilling-activity-index
- RRC drilling-permit query: https://webapps.rrc.texas.gov/
Consumer prices
- EIA Electric Power Annual / average revenue per kWh by state: https://www.eia.gov/electricity/annual/secrev-map.php
- EnergyBot / CostToRunIt state electricity rankings (June 2026 EIA vintage): https://www.energybot.com/electricity-rates/california/ and https://costtorunit.com/electricity-rates-by-state
- AAA Daily Fuel Gauge Report, Sept. 17, 2026: https://gasprices.aaa.com/
- Gasolytics state gasoline prices, Sept. 17, 2026: https://www.gasolytics.com/gas-prices-by-state
- Gasolytics state diesel prices, Sept. 17, 2026: https://www.gasolytics.com/diesel-prices-by-state
- EIA weekly retail gasoline: https://www.eia.gov/dnav/pet/pet_pri_gnd_a_epmr_pte_dpgal_w.htm
Oil price context
- WTI near $101 on Sept. 17, 2026 (futures): market prints summarized at https://www.gurufocus.com/economic_indicators/4510/oil-price
- AAA statement that crude was averaging about $100/bbl: https://gasprices.aaa.com/pump-prices-keep-climbing-as-crude-oil-remains-high-2/
Charts in this article were generated from the official and compiled series cited above. 2026 Colorado well-start figures are year-to-date through August 2, 2026, per ECMC. Permit-count definitions differ slightly by state (new drills vs. reworks vs. OGDPs vs. Form 2s); trailing-24-month figures used for the three-state snapshot are Buckhead Energy compilations from state regulator well-header files as of September 17, 2026.