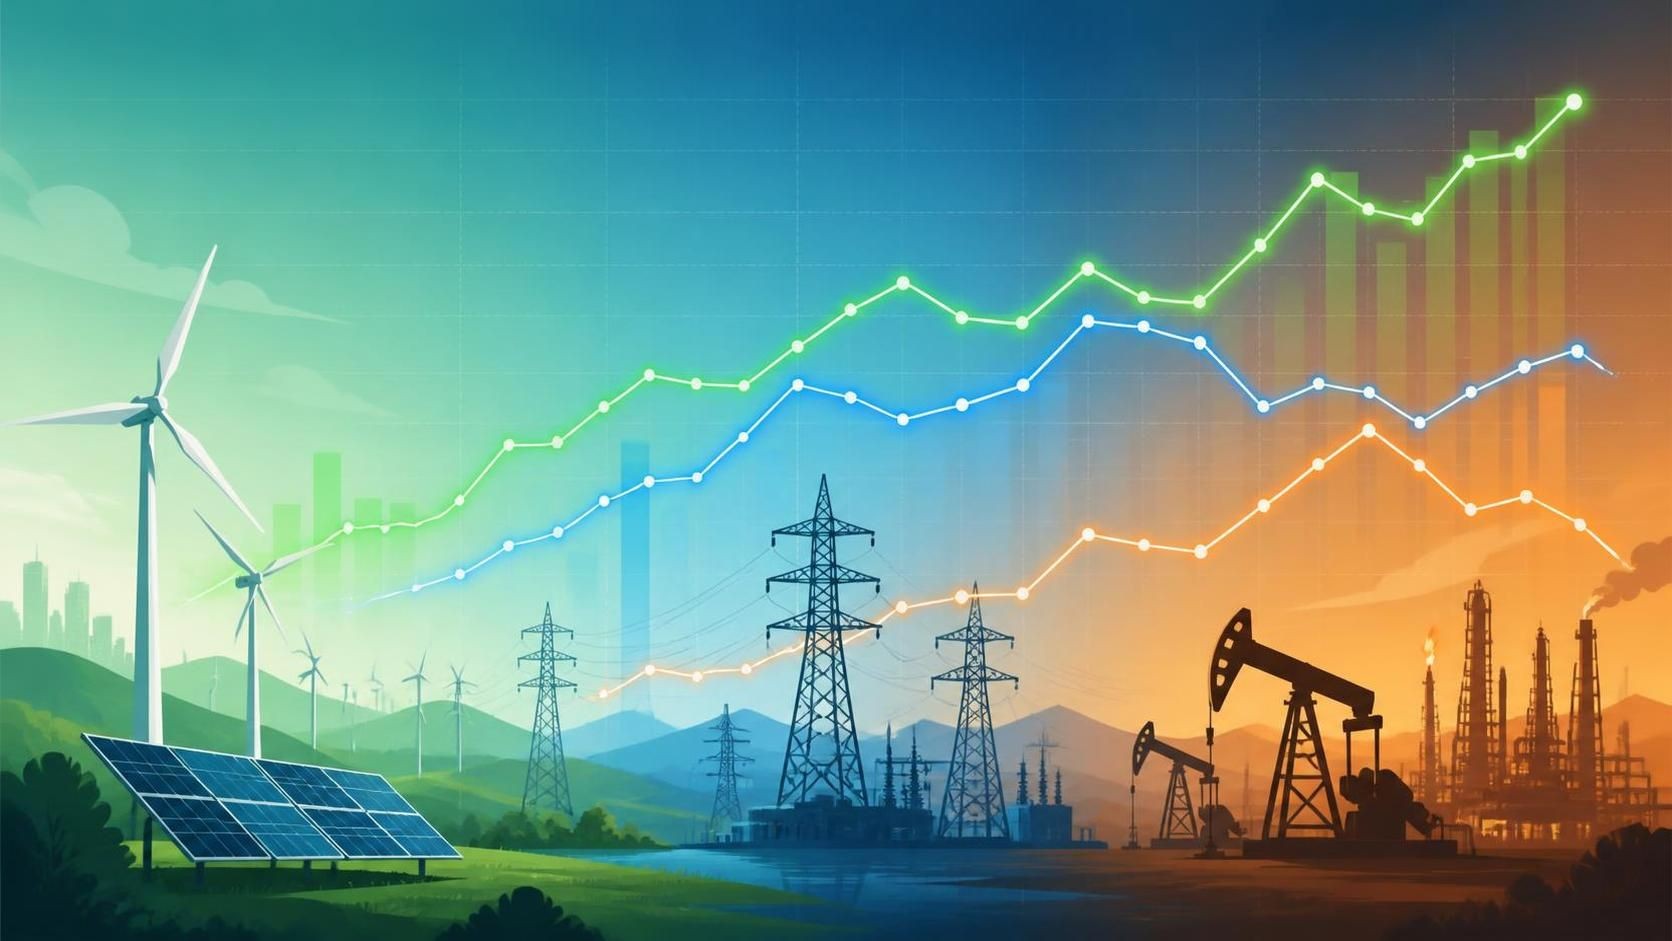
Green energy companies in wind, solar, and storage have shown a sharp split in recent results. A few pure-play or hybrid firms have turned profitable or posted strong growth, while many continue to struggle with execution, pricing pressure, subsidies dependence, and Chinese competition. Utilities have delivered consistent, regulated profitability with rising margins as they invest in infrastructure. Oil and gas majors remain the most profitable in absolute terms during periods of elevated commodity prices and refining margins, returning large sums to shareholders even as full-year 2025 results moderated from prior peaks.
Bloom Energy is included here because it markets its solid-oxide fuel cell systems as a lower-emission, on-site power solution (often using natural gas or biogas) and has positioned itself in the “green” or distributed clean energy category.
Green Energy: Wind, Solar, Storage, and Bloom Energy
Performance varies widely by segment and company.
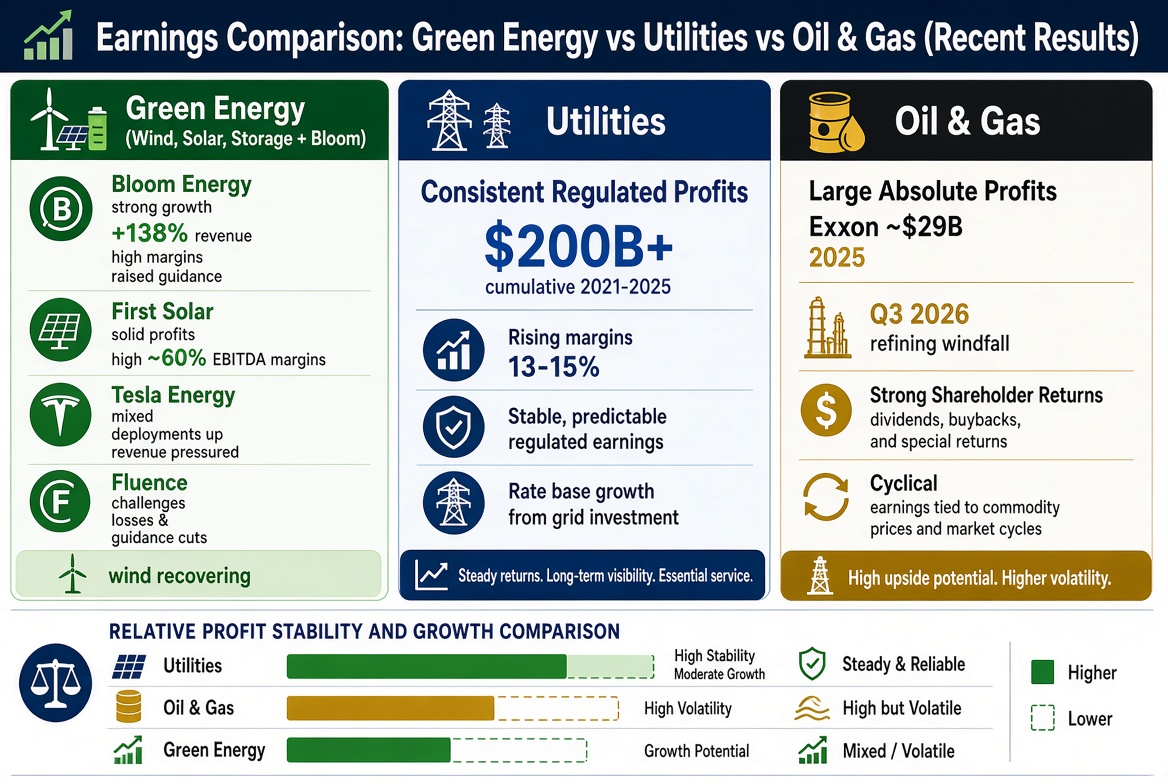
Bloom Energy (BE) has been a standout. In Q3 2026 it reported revenue of $1.236 billion (up 138% year-over-year), with non-GAAP diluted EPS of $0.94 (versus $0.15 a year earlier) and non-GAAP operating income of roughly $286 million. Gross margins expanded toward the mid-30% range. The company raised full-year 2026 guidance to $4.4–4.6 billion in revenue (about 122% growth at the midpoint) and non-GAAP EPS of $3.10–$3.40. Demand is driven by on-site power for hyperscalers and commercial customers seeking reliable electricity amid grid constraints and AI load growth. After years of losses, the business has scaled into consistent profitability.
First Solar (FSLR) delivered solid profitability despite volume headwinds. Q3 2026 net sales were $1.23 billion (down 23% YoY), but net income rose 25% to $571 million ($5.30 diluted EPS). Adjusted EBITDA margins reached around 60%. Full-year 2026 sales guidance was lowered to $4.6–4.9 billion. The company benefits from U.S. manufacturing and Section 45X production tax credits and maintains a large contracted backlog. Profitability has improved markedly from earlier years, though it remains sensitive to policy and international demand.
Storage shows mixed results. Tesla’s energy generation and storage segment deployed 13.7 GWh in Q3 2026 (up from 12.5 GWh a year earlier) with gross margins improving to 33.1%, but segment revenue fell 16% to $2.88 billion, partly due to tariff-related customer refunds. Management has cited record order rates and a strong backlog, with Megapacks nearly sold out into 2027 amid data-center demand. Tesla’s 2025 energy revenue was roughly $12.8 billion with solid segment margins. Fluence Energy has faced execution challenges: recent quarters showed revenue misses, continued losses, and significant cuts to fiscal 2026 guidance (revenue midpoint reduced by hundreds of millions) due to manufacturing ramp delays, even as order intake and backlog remain large.
Wind OEMs (Vestas, Siemens Gamesa under Siemens Energy, GE Vernova) have been recovering from prior heavy losses. Western manufacturers are returning toward profitability or break-even on the back of order books and cost actions, but face intense Chinese competition and margin pressure. Siemens Energy overall has posted strong results driven more by gas turbines and grid technologies than pure wind; its order backlog exceeds €160 billion in recent reports, with improving group margins.
Many pure-play renewables manufacturers remain more volatile and subsidy-dependent than oil, gas, or regulated utilities. Growth can be rapid when demand and policy align (as with Bloom and data-center power or U.S.-focused solar), but capital intensity, supply-chain issues, and policy risk are persistent.
Utilities: Steady, Regulated Profits
Investor-owned utilities have been consistently profitable. Analyses of more than 100 U.S. investor-owned electric utilities show cumulative net income exceeding $200 billion from 2021 through 2025. Average profit margins (net income as a share of revenue) have risen from around 13% in earlier years toward 14–15% in 2025 for many, with some (such as Florida Power & Light) reporting margins near or above 25% in recent periods.
Utilities earn regulated returns on equity on approved capital investments. Rising spending on distribution and transmission infrastructure (aging poles and wires, reliability upgrades, weather hardening, and connections for new load and generation) has expanded the rate base. NextEra Energy, a large regulated utility with a major renewables development arm, reported Q3 2026 adjusted EPS of $1.24 (up ~10% YoY) and is targeting the high end of $3.92–$4.02 adjusted EPS for full-year 2026, with long-term growth expectations of 8%+ annually. Customer bills have risen alongside these investments, transferring a portion of revenue into shareholder returns.
Oil and Gas Companies: Scale and Cyclical Strength
Supermajors delivered large absolute profits. For full-year 2025, ExxonMobil reported earnings of about $28.8 billion (down from $33.7 billion in 2024), Chevron about $12.3 billion (down from roughly $17.7 billion), and Shell adjusted earnings around $17.8–18.5 billion depending on the exact metric. Lower average crude prices in 2025 pressured upstream results even as production volumes rose in the Permian, Guyana, and elsewhere.
In Q3 2026, refining margins and commodity prices surged amid geopolitical disruptions (including effects from Middle East conflicts), producing a combined windfall for the majors on the order of $56 billion in adjusted net income for the quarter in some tallies. Companies have prioritized shareholder returns (dividends and buybacks) and balance-sheet strength over aggressive capex growth. Upstream production continues to expand in advantaged basins, and integrated models (upstream plus refining/chemicals) provide resilience when refining cracks widen.
Investors and Consumers: Profits, Investing, and Rising Energy Costs
Investors face different risk-return profiles. Oil and gas equities offer high cash returns and leverage to commodity prices but are cyclical and exposed to long-term demand and policy shifts. Utilities provide relatively stable, regulated returns supported by infrastructure spending and growing load (data centers, electrification), though growth is constrained by regulatory processes. Green energy pure plays can deliver high growth (Bloom’s recent trajectory is an example) but often require subsidies or tax credits, face technology and execution risk, and show greater earnings volatility. Hybrid players like NextEra combine regulated stability with renewable development upside.
Consumers have seen rising electricity bills in many regions. Multiple analyses (including from Lawrence Berkeley National Laboratory and utility financial reviews) point primarily to increased spending on distribution and transmission infrastructure rather than solely to generation fuel costs or renewable subsidies. Key drivers include:
- Replacement and hardening of aging distribution assets (poles, wires, transformers).
- Reliability and extreme-weather resilience investments.
- New transmission to connect renewables, serve growing load (especially data centers), and reduce congestion.
- Regulatory frameworks that allow utilities to earn a return on these capital investments.
Transmission and distribution capital spending has risen substantially over the past two decades and now accounts for a large share of utility capital expenditures. Additional transmission is needed both to integrate variable renewables and to meet demand growth, but permitting delays slow build-out and costs are passed through to ratepayers. Some critics argue that allowed returns on equity and the incentive to grow the rate base can lead to higher-than-necessary spending. Renewable integration adds system costs for flexibility, storage, and backup, while oil and gas provide dispatchable generation but face their own price volatility and environmental constraints.
In short, rising energy costs reflect a combination of infrastructure catch-up, load growth, weather resilience, and the grid upgrades required by a changing generation mix—not simply “more transmission lines” in isolation. Profits accrue to the owners of the capital deployed under the prevailing regulatory and market structures. Investors weigh cash returns and risk across oil/gas, regulated utilities, and higher-growth (but less certain) green pure plays. Consumers ultimately pay for reliability and capacity through rates, regardless of the generation technology.
Appendix: Sources and Links
- Bloom Energy Q3 2026 results and guidance: Company releases and earnings coverage (e.g., bloomenergy.com news, Motley Fool transcript, TipRanks).
- First Solar Q3 2026 results and guidance: Company investor relations and earnings coverage (Mercom, Securities.io, Motley Fool).
- Tesla energy segment Q3 2026 and prior results: Company updates, Electrek, Energy-Storage.News, and related coverage.
- Fluence Energy fiscal 2026 results and guidance revisions: Company IR and earnings reports.
- Siemens Energy and wind OEM context: Company reports, Windpower Monthly analyses, and sector coverage.
- NextEra Energy Q3 2026 results: Company releases and earnings coverage.
- Utility profit analyses: Energy and Policy Institute reports and coverage (Utility Dive, Inside Climate News, related media).
- Oil and gas 2025 and Q3 2026 results: Company releases, Enerdata, Industrial Info, Reuters, Oil & Gas Journal, and Bloomberg-compiled data.
- Electricity cost drivers and grid investment: Lawrence Berkeley National Laboratory analyses, EIA data on capital spending, IEA transmission reports, Yale Climate Connections, Politico/Power Switch coverage of LBNL findings, and related grid studies (DOE Transmission Impact Assessment).
Figures are drawn from company filings, earnings releases, and secondary reporting as of late 2026 and are subject to updates with subsequent results. This overview focuses on publicly reported financial performance and does not constitute investment advice.