Saudi Arabia has told OPEC that its crude production collapsed again in August 2026, falling 1.9 million barrels per day to 6.238 million b/d—the lowest level the kingdom has reported since 1990, at the outset of the Gulf War. Riyadh attributed the drop to renewed U.S.–Iran hostilities that squeezed its export routes.
That official communication, obtained by Bloomberg, lands as tanker rates hit records, the Bab el-Mandeb Strait tightens under Houthi advances, and the Strait of Hormuz remains a high-risk corridor. The physical oil is still in the ground. Getting it to customers is the problem.
Brent traded around $107–108 per barrel on September 10, with sharp intraday gains as Red Sea news hit. The market is no longer pricing a single chokepoint. It is pricing two.
Five years of OPEC production: from managed cuts to wartime shut-ins
Before the 2026 Iran war, OPEC production was a story of COVID recovery, then coordinated restraint, then a cautious unwind of voluntary cuts. The war turned it into a logistics and security story.
Approximate crude production for major members (thousand barrels per day, annual averages from OPEC/OAPEC statistical series through 2024):
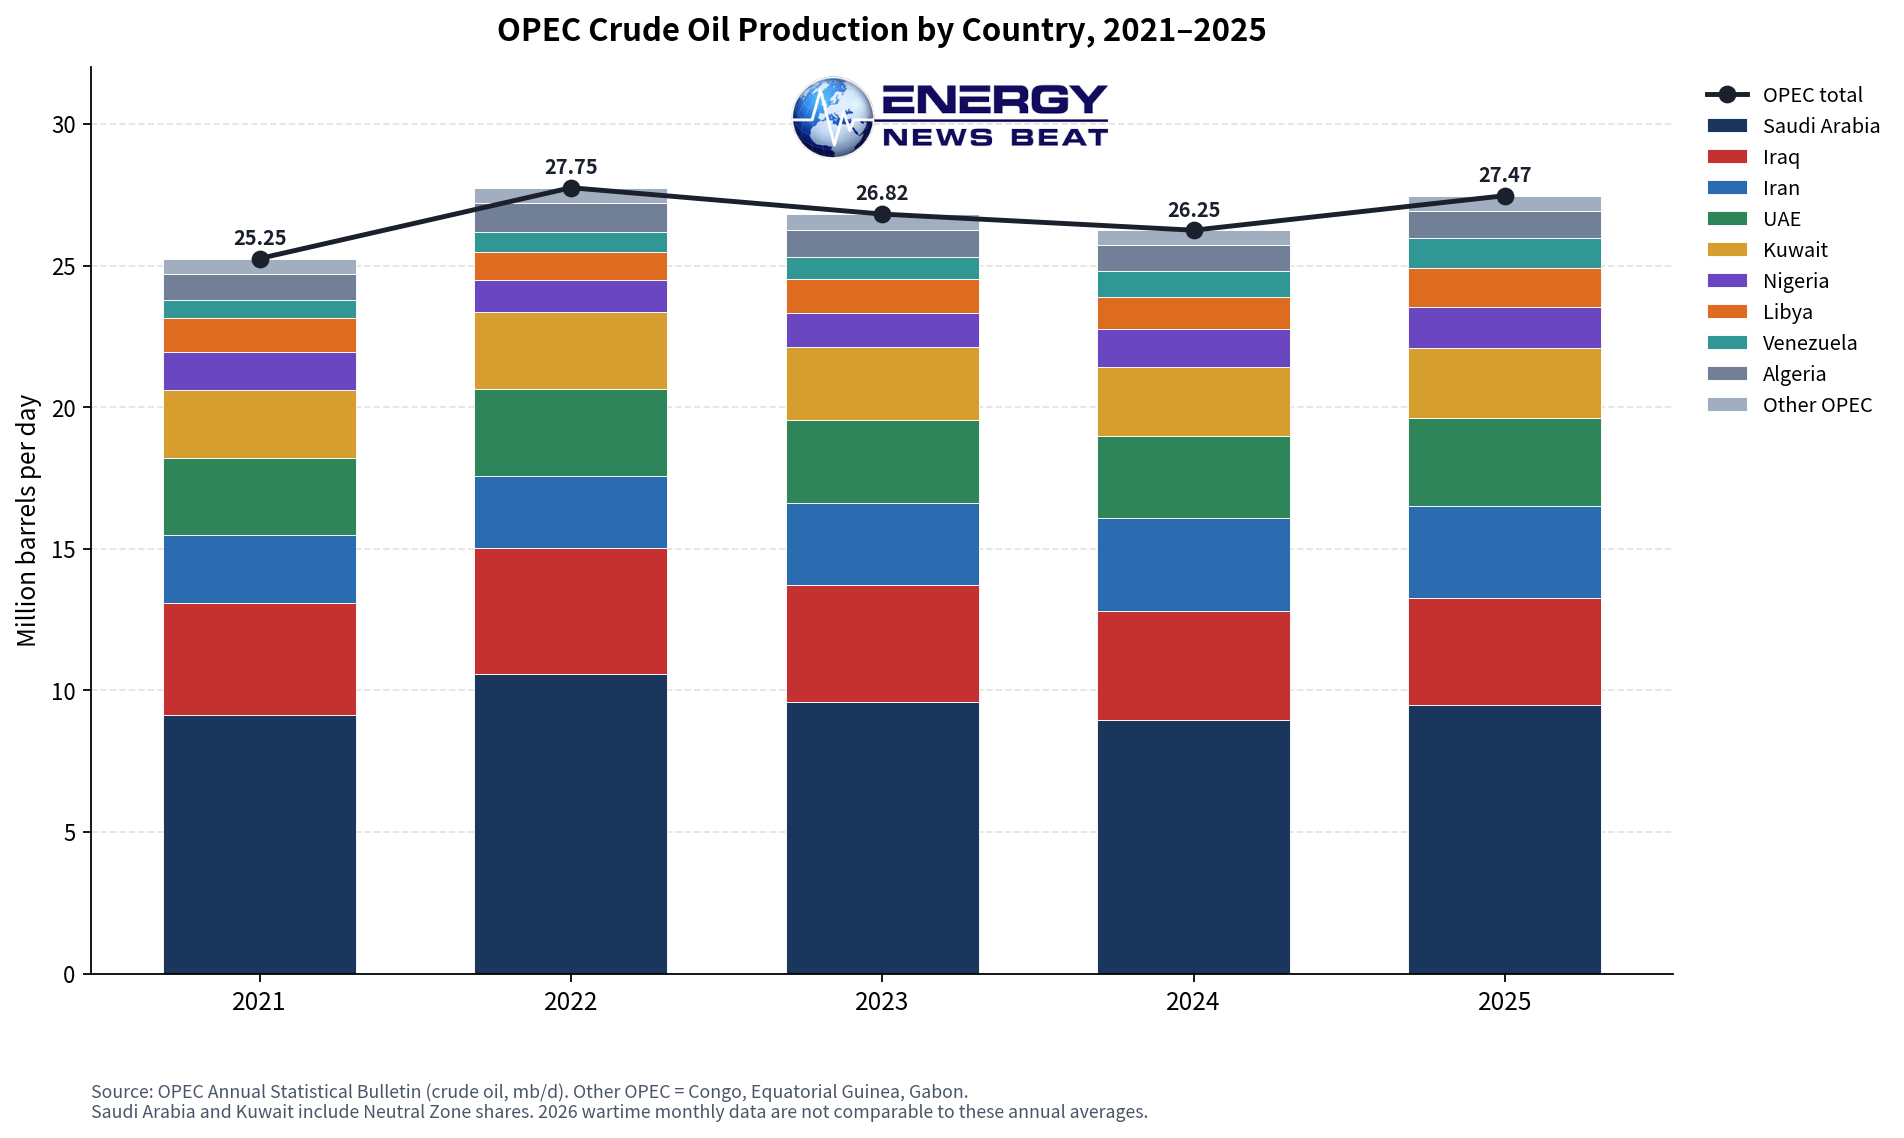
How has 2026 Shaped Up YTD?
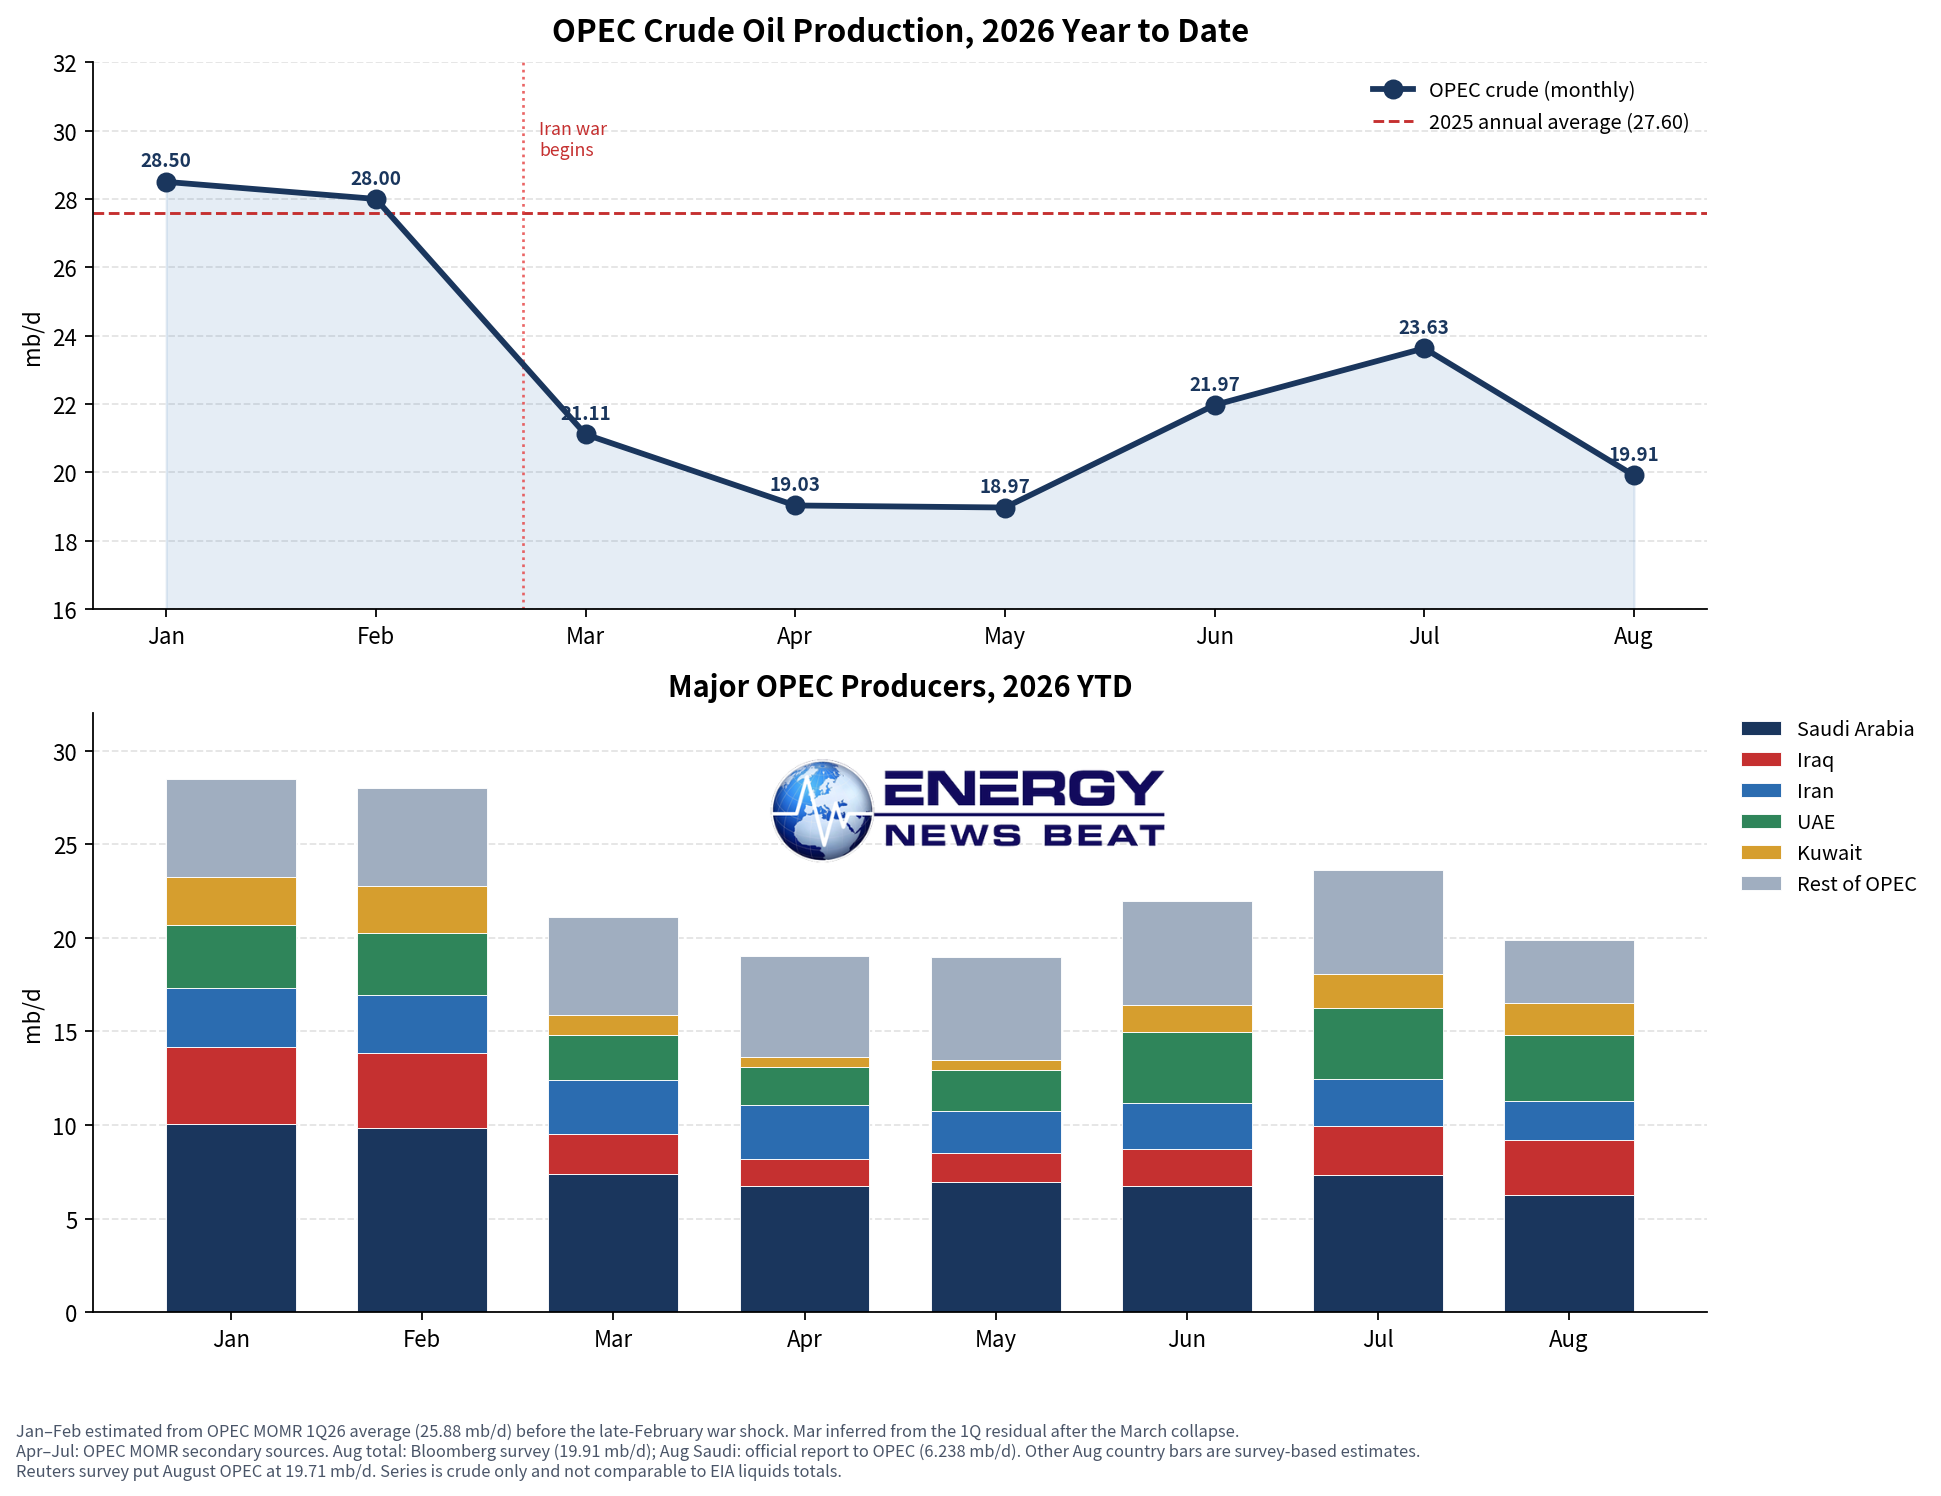
OPEC crude as a group ran roughly 26.6 mb/d in 2024 and about 27.6 mb/d in 2025 on secondary-source tallies, before the 2026 collapse. In the second quarter of 2026, OPEC crude fell toward the high teens to around 20 mb/d as Gulf export routes seized up. July saw a partial rebound as some pipeline workarounds and quota increases took effect. August then reversed again for Saudi Arabia.
Secondary surveys do not all match the 6.238 mb/d figure Saudi Arabia submitted to the secretariat. Bloomberg’s survey and other tracker estimates put August Saudi output closer to 6.9–7.3 mb/d and OPEC crude near 20–24 mb/d depending on the source and whether UAE volumes are still counted inside the group. The official Saudi number is what matters for the “lowest since 1990” claim: Riyadh itself says it could not move barrels.
The pattern by country is consistent. Saudi Arabia, Kuwait, and Iraq took the largest wartime hits because their export systems depend on the Gulf and, increasingly, Red Sea alternatives. Libya, Nigeria, and Venezuela were less exposed to Hormuz. Iran’s volumes swung with sanctions enforcement, dark-fleet activity, and direct conflict. Algeria and the smaller African members stayed relatively stable at low absolute levels.OPEC+ had been raising official targets—another 188,000 b/d for August across seven core producers—as it unwound 2023 voluntary cuts. Logistics overrode the paper quotas. Barrels that cannot load do not count.
Where the barrels go: Asia first
OPEC’s customer map has been eastbound for years. In 2024, OPEC members exported about 19.7 mb/d of crude; Asia took roughly 70 percent. China, India, Japan, South Korea, and the rest of Asia absorbed the bulk of Saudi, Iraqi, Kuwaiti, Emirati, and Iranian grades.
Saudi destinations in 2024 (OPEC ASB, thousand b/d) illustrate the exposure:
- OECD Asia Pacific: 1,787
- China: 1,495
- Other Asia: 907
- India: 624
- OECD Europe: 721
- OECD Americas: 320
Iraq’s largest outlets were China, India, and Europe. Iran’s official and unofficial flows concentrated on China and “other Asia.” African members split between Europe, India, and China. Latin America and the United States are secondary markets for most OPEC crude.
In value terms, OPEC goods exports in 2024 were about $755 billion, with China the top destination at $151 billion, followed by India and South Korea. Crude petroleum alone was $464 billion. That is why a dual-chokepoint crisis is an Asian landed-cost crisis first and a European/U.S. price crisis second.
When Hormuz is impaired, Saudi Arabia shifts more volume to Yanbu on the Red Sea. That only works if Bab el-Mandeb stays open. This week, that assumption weakened.
Two straits, record freight
Oil tanker rates have gone vertical because vessels are being tied up on longer, riskier voyages. The benchmark VLCC rate from the Middle East to China has printed near $800,000 a day. A U.S. Gulf Coast–to-Asia supertanker fixture has reached a $29.5 million lump sum before war-risk extras. Brokers at Fearnleys said the VLCC list is so tight that Worldscale 400 on a Fujairah–East run would no longer surprise anyone.
Equinor’s Alex Grant called it simultaneous bottlenecks. The oil exists. The ships that can safely carry it do not.
The Strait of Hormuz remains the core problem: low transit counts, U.S.–Iran tanker strikes, and Iranian efforts to interdict Gulf loadings. Saudi workarounds via the northern Red Sea and Egyptian Mediterranean ports add days and absorb tonnage.
Bab el-Mandeb is now the second shock. On September 10, Houthi forces captured Mocha (Mokha), tightening control over approaches to the strait. Transits plunged. The group has already declared a maritime embargo aimed at Saudi-linked shipping. Saudi crude that left Ras Tanura for Yanbu to escape Hormuz now faces a Red Sea gauntlet. A dual closure—or even a dual “operationally hazardous” status—removes the main bypass.
That is why freight is not a sideshow. At $800,000 a day for a VLCC, freight and insurance can add several dollars a barrel to Asian delivered cost on top of the already elevated flat price. Inefficient routing (Cape of Good Hope instead of Suez/Red Sea) extends voyage times, reduces effective fleet supply, and feeds the next rate spike.
How investors and consumers should read this market
This is not a classic OPEC quota story. It is a chokepoint-and-freight story sitting on top of a war.
For consumers:
Pump prices and diesel costs will stay volatile and biased higher while both straits are impaired. The pain is uneven. Asia feels freight most directly. Europe feels product and middle-distillate tightness. The United States is buffered by domestic crude but not immune to gasoline cracks, jet fuel, and imported products. Demand destruction becomes real if Brent holds above $100–120 for months. That is the only automatic stabilizer the market has left besides SPR releases and non-OPEC barrels from the United States, Brazil, Guyana, and Canada.
For investors:
Treat the complex as a barbell of logistics risk and eventual mean reversion.
- Tanker owners and war-risk underwriters are the cleanest near-term beneficiaries of scarce ships and long-haul diversions.
- Upstream producers with secure export routes (U.S. shale, Canada, Brazil, Guyana, Norway) capture the price without the same loading risk.
- Gulf NOCs and OPEC equity proxies carry political and operational haircuts that the headline oil price does not fully offset.
- Airlines, chemicals, and freight-intensive industrials are short the disruption.
- Refiners are mixed: wide crude differentials can help; missing medium-sour grades and expensive freight can hurt.
Position sizing matters more than directional bravado. The distribution of outcomes is unusually wide. A ceasefire-plus-open-straits path can dump prices toward the $60s–$70s in 2027. A dual-blockade path can overshoot $120. Inventories in the OECD have not collapsed as fast as the war narrative implied, which is why some banks keep base cases well below the spot price. That buffer can disappear quickly if Red Sea loadings fail.
Hedge what you cannot afford. Consumers and airlines should be looking at 2027 distillate and crude structures, not hoping September news fades. Equity investors should separate “oil price up” from “this specific barrel can load.”
Is Goldman Sachs’s higher-price call looking right?
Goldman’s latest revision (early September) is a modest base-case upgrade and a loud tail-risk warning.
The bank lifted December 2026 Brent to about $85 and WTI to $80, and 2027 averages to roughly $80 and $75. That is only $5 above its prior marks. The important line is the scenario work: Brent could exceed $120 if 2027 average Gulf output stays 4 million b/d below pre-war levels. Intensified attacks on Hormuz and Red Sea shipping are the stated upside trigger. A full normalization path still points toward the $60s.
Is that “accurate”? The base case already looks conservative versus a $107–108 spot print and today’s Houthi advance on Mocha. Goldman itself noted that OECD commercial inventories have barely drawn and that pipelines plus unrecorded flows cushion the shock—hence the small upgrade. Those cushions shrink if Bab el-Mandeb joins Hormuz as a binding constraint. In that sense, the $120 scenario is doing more work this week than the $85 year-end target.
Other desks have moved in the same direction, with different numbers:
- HSBC raised 2026 Brent to $90 and 2027 to $85, and also flagged a ~$120 stalemate case if Hormuz flows stay suppressed.
- UBS lifted year-end Brent to $95 and mid-2027 to $85, citing tighter inventories and upside-skewed risk.
- EIA (September STEO) now sees 2026 Brent averaging about $91 and 2027 about $74, with Middle East production remaining below pre-conflict averages into 2027.
- Bank of America put H2 2026 Brent around $83 and 2027 around $75, with a $95–$120 range if disruptions last through year-end.
The consensus base case is not $120. The consensus risk case is. Goldman’s framework—modest official target, fat right tail—is consistent with how the rest of the Street is writing the tape. Whether $85 year-end proves right depends almost entirely on whether Saudi and other Gulf barrels can physically sail, not on OPEC communiqués.
The market’s message on September 10 is simple. OPEC output at a 1990-style Saudi low is not a policy choice. It is a shipping failure. Until Hormuz and Bab el-Mandeb both function, tanker rates will stay extreme, Asian buyers will pay a delivery premium, and price forecasts will keep getting rewritten every time a port on the Yemeni coast changes hands.
Check out the World’s Greatest Podcast Show Notes at EnergyNewsBeat.co or EnergyNewsBeat.com.
Appendix: Sources and links
- Bloomberg: “Saudis Tell OPEC That Output Slumped Again to Lowest Since 1990” — https://www.bloomberg.com/news/articles/2026-09-10/saudis-tell-opec-that-output-slumped-again-to-lowest-since-1990
- OilPrice.com: “Oil Tanker Rates Hit Record Highs as Middle East Shipping Risks Soar” — https://oilprice.com/Latest-Energy-News/World-News/Oil-Tanker-Rates-Hit-Record-Highs-as-Middle-East-Shipping-Risks-Soar.html
- Bloomberg (related tanker piece referenced by OilPrice): “Surging Tanker Rates Signal a Deepening Global Energy Crisis”
- CNN: Houthi capture of Mocha / Bab el-Mandeb — https://www.cnn.com/2026/09/10/middleeast/houthis-capture-mocha-red-sea-strait-intl
- Reuters: Houthis close in on Bab el-Mandeb — https://www.reuters.com/world/middle-east/saudi-says-no-danger-after-khamis-mushait-alert-amid-clashes-with-houthis-2026-09-10/
- The National: Bab al-Mandeb and Hormuz transits plunge — https://www.thenationalnews.com/business/energy/2026/09/10/bab-al-mandeb-and-hormuz-ship-transits-plunge-as-war-intensifies/
Production and trade statistics
- OPEC Annual Statistical Bulletin 2025 (production and Table 5.1 export destinations) — https://www.opec.org/assets/assetdb/asb-2025.pdf and https://publications.opec.org/asb
- OPEC Monthly Oil Market Report (August 2026 edition and subsequent updates) — https://publications.opec.org/momr
- OAPEC Annual Statistical Report 2025 — production tables for member countries
- EIA Short-Term Energy Outlook — https://www.eia.gov/outlooks/steo/
- Observatory of Economic Complexity, OPEC trade profile — https://oec.world/en/profile/international_organization/opec
- Visual Capitalist / 2024 crude trade-flow mapping — https://www.visualcapitalist.com/mapped-global-crude-oil-trade-flows-by-region-2024/
Analyst forecasts
- Goldman Sachs revisions and $120 scenario: MarketWatch — https://www.marketwatch.com/story/goldman-sachs-reverses-engines-on-oil-price-forecasts-and-raises-the-specter-of-120-per-barrel-crude-d8da110c
- InvestmentNews / CBS / Mining Weekly coverage of the same Goldman note
- HSBC forecast raise — https://www.rigzone.com/news/hsbc_analysts_significantly_raise_oil_price_forecasts-09-sep-2026-184572-article/
- UBS forecast raise — https://finance.yahoo.com/energy/articles/ubs-raises-oil-price-forecasts-132745985.html
- EIA price revision coverage — https://economymiddleeast.com/news/eia-raises-2026-brent-average-forecast-to-91-as-middle-east-disruptions-pressure-inventories/
- Bank of America forecast raise — MarketScreener / BofA note summaries, Sept. 8, 2026
Prices
- ICE Brent / spot prints around Sept. 10, 2026: MarketWatch, Inve