


Diesel prices in the United States have smashed records, topping $6 per gallon nationally and exceeding $7 on the West Coast, while inventories sit well below five-year averages. Truckers, farmers, freight operators, and industrial users feel it first. The pain is global: European and Asian markets have also hit or approached records as middle-distillate supplies tighten. Crude oil is relatively plentiful. Refined diesel is not.
The immediate spark is geopolitical. Ukrainian drone strikes have repeatedly hit Russian refineries—the world’s second-largest diesel exporter—cutting output and prompting Moscow to ban diesel exports. Conflicts involving Iran have damaged or idled Gulf refining capacity and constrained the Strait of Hormuz, slashing Middle Eastern product shipments. Combined losses exceed 1 million barrels per day of diesel supply. Global refining runs are down millions of barrels per day, inventories are drawing, and spare capacity is scarce. The International Energy Agency and industry analysts expect tightness to persist into 2027.
These shocks exposed a system already running thin. Historian Susan Kokinda, in a widely shared breakdown posted by @gaye_gallops, framed the deeper issue plainly: “Scarcity Was The Policy.” Decades of policy choices in the West treated reliable hydrocarbon infrastructure as a problem to be phased out rather than a foundation to be maintained and expanded. The result is a refining fleet that cannot easily absorb outages.
Refineries Closed by Design
Western refining capacity has contracted for years. Europe has shut roughly 28 refineries above 30,000 barrels per day since 2009 and lost another 400,000–500,000 barrels per day in 2025 alone, including Petroineos’ Grangemouth in Scotland and Shell’s Wesseling in Germany. Processing capacity is projected to shrink another 20 percent by 2035. The United Kingdom is down to four operating refineries after Grangemouth and Prax Lindsey closed in 2025. Industry groups warn of “high-risk, low-resilience” import dependence. Carbon costs under the UK and EU Emissions Trading Schemes impose hundreds of millions of pounds annually that competitors in the United States, India, or the Gulf do not face. Requests to include refined products in carbon-border adjustments were rejected.
California illustrates the same pattern at the state level. Operational refineries fell from 23 in 2000 to 11 after Phillips 66 ended crude processing at Wilmington/Carson in late 2025 and Valero idled Benicia in April 2026—removing 17–20 percent of remaining in-state capacity. Unique CARBOB gasoline specifications, the Low Carbon Fuel Standard, cap-and-trade, and aggressive net-zero and EV mandates raised costs and encouraged conversions to renewable diesel rather than conventional output. The isolated West Coast market now relies more heavily on imports. Prices there remain the nation’s highest. No new greenfield refinery has been built in the United States since the 1970s.
These closures were not accidents of market forces alone. They followed explicit policy: renewable portfolio standards, carbon pricing that does not apply equally to imports, fuel specifications that fragment markets, and political rhetoric treating refining as a sunset industry. When demand for diesel—used in agriculture, trucking, construction, backup generation for data centers, and industry—did not vanish on schedule, the buffer disappeared.
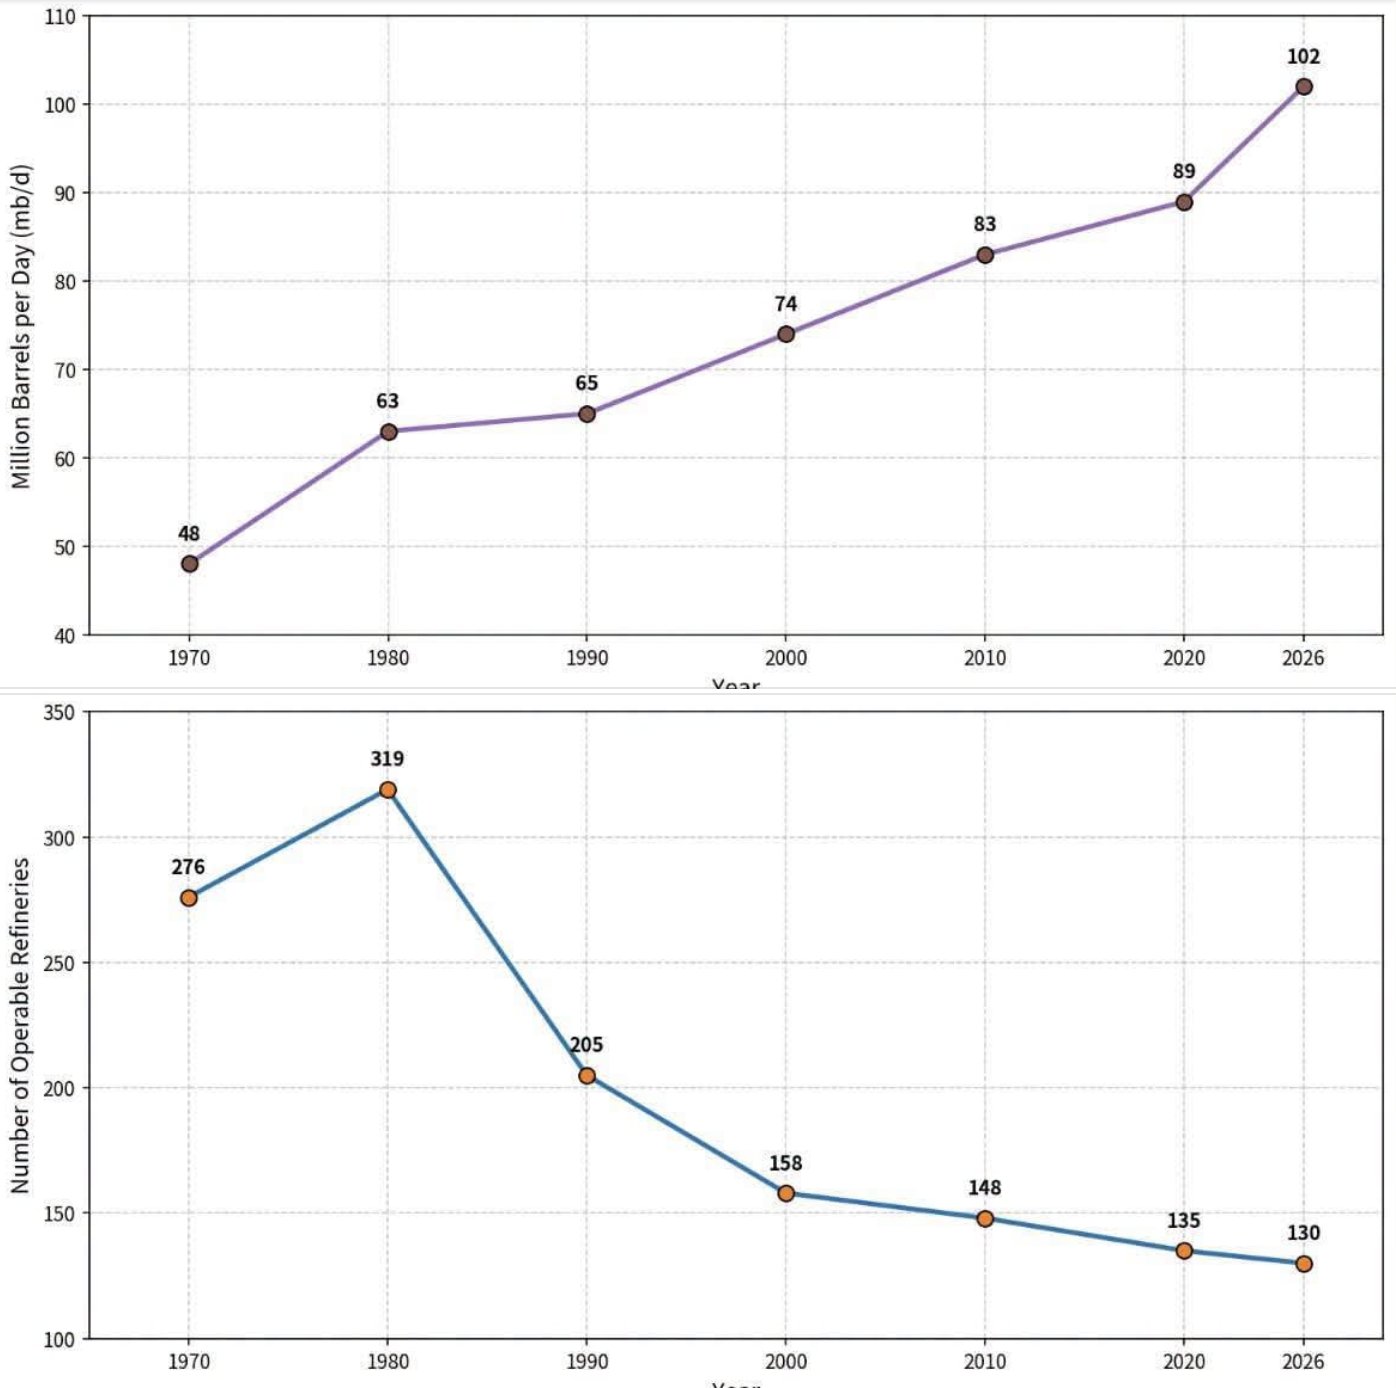
Rod D. Martin on X hits the point home.
Total global oil production since 1970 is up 113%. (And U.S. production has nearly tripled since 2008.) Yet the total number of US refineries in 2026 is 130, down from 319 in 1980. During that time, demand for gasoline has increased significantly because our population grew by an additional 100 million people. You can pump all the crude oil you want, but if you can’t convert it into gasoline and diesel, it doesn’t matter, at least not for gas prices. Why did this happen?
Because blue states closed refineries to move toward stupid “Net Zero” and “Green New Deal” goals. And Democrat Presidents from Carter to Biden imposed restrictions on refinery construction so draconian that no one could afford to build…if they could even get a permit. But sure, blame Trump, the first President to actually do something about it. Instead, elect the people who TOLD YOU they wanted to “ban fossil fuels” and push the price of gas over $10/gal., and then relentlessly implemented policies to get us as far in that direction as they could.
Secretary Chris Wright’s Case for Energy Addition
U.S. Energy Secretary Chris Wright has been blunt about the policy record and the required response. For 17 years, he notes, policies attacked hydrocarbons and closed refineries and coal plants. The way to solve a shortage is to grow supply, not restrict it. An outright diesel export ban, he argues, is a “blunt hammer” that would fill domestic tanks, force refiners already running near 98 percent utilization to cut crude runs, and raise prices for gasoline and jet fuel as well. The United States is a structural diesel surplus producer; the world is short. Voluntary adjustments in flows make more sense than a ban that would damage America’s role as an energy supplier.
Wright’s broader framework is energy addition, not subtraction. He supports “all-of-the-above” sources that deliver affordable, reliable power—oil, gas, coal where needed, nuclear (fission and fusion), and renewables that actually perform. Wind and solar, he points out, do not produce when the sun is down or the wind is still; treating them as baseload replacements has raised electricity prices in states with aggressive mandates. The administration’s goal is lower cost and higher performance, re-industrialization, and energy dominance so the United States can supply itself and allies. Climate policies that make energy expensive, he argues, impoverish citizens and shift manufacturing—and emissions—overseas.
Energy Poverty Is Not Abstract
The human cost of scarcity extends far beyond Western pump prices. As of the latest Tracking SDG 7 data, 655 million people still lack electricity and roughly two billion lack access to clean cooking fuels, relying on wood, charcoal, kerosene, or dung. Sub-Saharan Africa accounts for the bulk of the gap; progress has slowed. Indoor air pollution from traditional cooking kills millions annually. Energy access underpins health, education, refrigeration, industry, and escaping extreme poverty. Wright has asked where the equivalent of COP conferences is for this more immediate crisis. Developing countries consume a fraction of the energy of wealthy nations; they need far more, including hydrocarbons, to raise living standards.
Kokinda’s video juxtaposes $6 diesel with images of traditional wood-fired cooking. The contrast is the point: policies that constrain reliable energy in the name of climate goals have left both rich and poor more vulnerable.
The Energy Realities Podcast team will be covering this and more live on LinkedIn and YouTube Monday Morning at 9:00 Central Texas.

A Total Energy Solution
The path out is not another round of mandates that close plants faster than alternatives can replace them. It is pragmatic abundance: maintain and expand refining and generation capacity that works around the clock; accelerate nuclear; permit infrastructure; price carbon consistently if at all rather than unilaterally; and treat energy security as a first-order national interest. Diesel will remain essential for heavy transport and industry for years. Pretending otherwise while shutting the machines that make it produced the current shortage.
Geopolitical shocks will keep happening. A system with spare capacity and diversified, reliable supply can absorb them. A system designed around scarcity cannot. The global diesel crisis is the predictable result of treating energy as a moral problem rather than an engineering and economic one.
Appendix: Sources and Links
- Gaye Gallops X post featuring Susan Kokinda video: https://x.com/gaye_gallops/status/2103462184395440533
- IER: Why Are Diesel Prices So High? https://www.instituteforenergyresearch.org/fossil-fuels/gas-and-oil/why-are-diesel-prices-so-high/
- Dr. Greg Ibendahl: Why Diesel Prices Are So High https://agricultural.substack.com/p/why-diesel-prices-are-so-high
- A1AYN: The puzzle of cheap crude and expensive diesel https://www.a1ayn.com/blog/puzzle-of-cheap-crude-and-expensive-diesel/
- S&P Global: Diesel export ban would send shockwaves https://www.spglobal.com/energy/en/news-research/latest-news/crude-oil/092326-diesel-export-ban-would-send-shockwaves-through-us-refining-system
- EPRINC: U.S. Diesel Price Spikes https://eprinc.org/u-s-diesel-price-spikes-and-why-an-export-ban-would-backfire/
- The Oil Slick: Why the World Keeps Running Short of Diesel https://theoilslick.com/article-global-diesel-refining-capacity-shortfall.html
- Global Petroleum Advisors: Global Diesel Shortage Likely to Last Into 2027 https://globalpetroleumadvisor.com/global-diesel-shortage-likely-to-last-into-2027-what-prolonged-supply-tightness-means-for-global-diesel-markets/
- Nation Thailand: Global diesel shortage pushes US prices above US$6 https://www.nationthailand.com/business/economy/40071345
- Reuters: US diesel exports ban would hurt global fuel markets https://www.reuters.com/world/us/ban-us-diesel-exports-would-hurt-not-help-fuel-markets-analysts-say-2026-09-22/
- IRU: Diesel prices surpass previous 2026 records https://www.iru.org/news-resources/newsroom/diesel-prices-surpass-previous-2026-records
- World Ports Organization on export ban effects https://www.worldports.org/a-us-diesel-export-ban-would-trigger-global-stock-drawdowns-cut-us-refinery-utilisation-and-risk-driving-gasoline-prices-higher/
- Global Energy Flow: Diesel Shortage Today https://global-energy-flow.com/shortages/diesel/
- Atlantic Council: No quick fixes for the squeeze on refined products https://www.atlanticcouncil.org/blogs/energysource/no-quick-fixes-for-the-squeeze-on-refined-products/
- Hedgeye/Lacalle: The Great Diesel Crisis https://app.hedgeye.com/insights/187324-lacalle-the-great-diesel-crisis-how-policy-choices-made-the-west-vul
- Oil & Gas Journal / S&P: Refined product tightness deepens https://www.ogj.com/general-interest/economics-markets/news/55405149/sp-global-refined-product-tightness-deepens
- NYT: At a Times Event, Dueling Visions (Chris Wright) https://www.nytimes.com/2026/09/23/climate/climate-forward-chris-wright.html
- NY Post: Energy Secretary Chris Wright rejects outright diesel exports ban https://nypost.com/2026/09/23/business/us-energy-secretary-chris-wright-rejects-diesel-exports-ban/
- Heatmap News: Chris Wright Doesn’t Think We’ll Have a Diesel Export Ban https://heatmap.news/energy/chris-wright-diesel
- NYT: Chris Wright Sells Trump’s ‘Energy Dominance’ Vision https://www.nytimes.com/2026/09/23/climate/the-former-fracking-executive-selling-trumps-energy-dominance-vision.html
- Heatmap transcript: Energy Secretary Chris Wright https://heatmap.news/podcast/shift-key-152-chris-wright-transcript
- CBS Face the Nation transcript with Wright https://www.cbsnews.com/news/chris-wright-energy-secretary-face-the-nation-09-06-2026/
- Yahoo/Wright on fossil fuels and energy poverty https://www.yahoo.com/news/world-needs-now-more-fossil-161729441.html
- Atlantic Council: Wright on energy crisis recovery https://www.atlanticcouncil.org/blogs/energysource/us-energy-secretary-chris-wright-it-will-take-many-months-to-get-back-to-normal-after-this-energy-crisis/
- KQED: California’s Fuel Fears and Benicia https://www.kqed.org/science/2000877/californias-fuel-fears-threaten-benicias-just-transition-to-green-economy
- The Times: Carbon taxes threaten Britain’s last refineries https://www.thetimes.com/business/energy/article/carbon-tax-green-uk-oil-refineries-tvqpsl3dl
- S&P Global: California’s refinery closures https://www.spglobal.com/energy/en/news-research/latest-news/crude-oil/052026-californias-refinery-closures-create-volatile-fuel-prices-supply-gaps
- Financial Times: Western oil refinery closures set to continue https://www.ft.com/content/eae8bbc5-7946-4fdc-8e0a-3215f7e56dd2
- Energy News Beat: UK refineries killed off by high carbon costs https://energynewsbeat.co/carbon-credit/uk-refineries-are-being-killed-off-by-high-carbon-costs-how-u-s-blue-states-are-following-the-same-playbook/
- GB News: UK risks becoming high risk, low resilience https://www.gbnews.com/money/uk-risks-becoming-high-risk-low-resilience-on-fuel-as-refineries-close-industry-warns
- Chemistry World: How decarbonisation will help UK’s last refineries https://www.chemistryworld.com/features/how-decarbonisation-will-help-the-uks-last-refineries-survive/4021607.article
- Watt-Logic: New report into the refineries sector https://watt-logic.com/2026/08/31/refineries-report-says-abolish-the-ets/
- NYT: California’s High Gas Prices Could Climb Further https://www.nytimes.com/2025/09/16/business/energy-environment/california-gas-prices-oil-refineries.html
- Pipeline & Gas Journal: California Confronts Refinery Closures https://pgjonline.com/magazine/2026/june-2026-vol-253-no-6/features/california-confronts-refinery-closures-and-long-term-energy-demand
- IEA: 655 million people still living without electricity https://www.iea.org/news/655-million-people-still-living-without-electricity-underscore-urgent-need-to-deliver-on-universal-energy-access-target
- IEA Tracking SDG7 reports 2025/2026 https://www.iea.org/reports/tracking-sdg7-the-energy-progress-report-2026 and https://www.iea.org/reports/tracking-sdg7-the-energy-progress-report-2025
- IEA World Energy Outlook 2025: Achieving access for all https://www.iea.org/reports/world-energy-outlook-2025/achieving-access-for-all
- IER: California’s Green Gambit timeline https://www.instituteforenergyresearch.org/big-green/californias-green-gambit-a-timeline/
- IER: California Turns to Imports as Its Refineries Close https://www.instituteforenergyresearch.org/fossil-fuels/gas-and-oil/california-turns-to-imports-as-its-refineries-close/
- Breakthrough Institute: How California Regulated Itself Into an Energy Crisis https://thebreakthrough.org/issues/energy/how-california-regulated-itself-into-an-energy-crisis
- Additional Susan Kokinda discussion context: https://www.facebook.com/61577697047500/videos/… and YouTube interviews such as https://www.youtube.com/watch?v=AIq0a6l_x1s
All figures and statements are drawn from the cited reporting and official data current as of late September 2026.